In situ visualization and dynamics of newly synthesized proteins in rat hippocampal neurons - PubMed (original) (raw)
. 2010 Jul;13(7):897-905.
doi: 10.1038/nn.2580. Epub 2010 Jun 13.
Affiliations
- PMID: 20543841
- PMCID: PMC2920597
- DOI: 10.1038/nn.2580
In situ visualization and dynamics of newly synthesized proteins in rat hippocampal neurons
Daniela C Dieterich et al. Nat Neurosci. 2010 Jul.
Abstract
Protein translation has been implicated in different forms of synaptic plasticity, but direct in situ visualization of new proteins is limited to one or two proteins at a time. Here we describe a metabolic labeling approach based on incorporation of noncanonical amino acids into proteins followed by chemoselective fluorescence tagging by means of 'click chemistry'. After a brief incubation with azidohomoalanine or homopropargylglycine, a robust fluorescent signal was detected in somata and dendrites. Pulse-chase application of azidohomoalanine and homopropargylglycine allowed visualization of proteins synthesized in two sequential time periods. This technique can be used to detect changes in protein synthesis and to evaluate the fate of proteins synthesized in different cellular compartments. Moreover, using strain-promoted cycloaddition, we explored the dynamics of newly synthesized membrane proteins using single-particle tracking and quantum dots. The newly synthesized proteins showed a broad range of diffusive behaviors, as would be expected for a pool of labeled proteins that is heterogeneous.
Figures
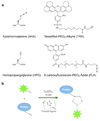
Figure 1. Chemical components and FUNCAT procedure
(a) Chemical structures of the modified amino acids azidohomoalanine (AHA) and homopropargylglycine (HPG), and the two fluorescent tags TexasRed–PEO2–Alkyne (TRA) and 5–carboxyfluorescein–PEO8–Azide (FLA) used in this study to visualize newly synthesized proteins. (b) Cartoon illustrating the Cu(I)–catalyzed [3+2] azide–alkyne cycloaddition (CuAAC) principle.
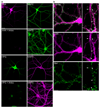
Figure 2. Visualization of newly synthesized proteins in dissociated primary hippocampal neurons
(a) Dissociated hippocampal neurons (DIV 17) were incubated with either 2 mM AHA or 2 mM HPG in the presence or absence of 40 µM anisomycin (Aniso) for 1 h, tagged with 1 mM TRA or FLA tag and immunostained for the dendritic marker protein MAP2. Scalebar = 20 µm. (b) Dissociated neurons were incubated with 2 mM AHA for 2 h followed by tagging with 1 mM TRA tag and immunostaining for Bassoon as a synaptic marker. Arrowheads denote spine–like protrusions. Scalebar = 10 µm in the left panel images, scalebar = 5 µm in the magnified images.
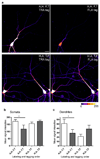
Figure 3. Sequential labeling of 2 newly synthesized protein pools with two metabolic markers
(a) Dissociated hippocampal neurons (DIV 16–18) were incubated in 2 mM AHA for 1.5 h followed by 4 mM HPG for 1.5 h and vice versa, and sequentially tagged with either 1 mM TRA then 1 mM FLA tag, or FLA tag followed by TRA tag for 12 hours each. Scalebar = 20 µm. Color lookup table indicates fluorescence intensity (pixel intensities 0–255). Labeling and detection sequences: A,H, F,T: first AHA then HPG, first FLA then TRA tag; H,A, T,F: first HPG then AHA, first TRA then FLA tag. Images were acquired and analyzed using identical parameters on a Zeiss Meta 510 confocal microscope using a 40x objective, postprocessing and analysis was done with ImageJ. Graph (b) represents mean intensities ± SEM of somata for the indicated labeling and detection sequences. Graph (c) represents mean intensities ± SEM of dendrites (0–100 µm) for the indicated tagging and detection sequences. White boxes correspond to TRA signals, grey boxes indicate FLA signals. n = 6–10 neurons. P–values: ** p < 0.005; * p < 0.05.
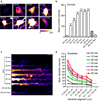
Figure 4. Time–course for the detection of newly synthesized proteins in somata and dendrites
(a) Cultures (DIV 16) were incubated for the time points indicated with 2 mM AHA, 2 mM methionine (Met) or 2 mM AHA in the presence of 40 µM anisomycin (Aniso). After cycloaddition with the fluorescent TRA tag, images were acquired with identical parameters on a Zeiss Meta 510 confocal microscope using a 63x objective. Scalebar = 5 µm. Graph (b) represents mean intensities ± SEM of the somata. Per time point, data from 20–50 cells were collected and analyzed using ImageJ. Representative examples are shown in the right panel. (c) Representative straightened dendrites of neurons incubated with 2 mM AHA, 2 mM Methionine (Met) or AHA plus 40 µM anisomycin (Aniso) for time points indicated. Color lookup table indicates fluorescence intensity (pixel intensities 0–255). Left: proximal; right: distal. Scalebar = 10 µm. Graph (d) represents mean intensities ± SEM of the dendrites in 20 µm bins. Per time point data from 25–40 dendrites were analyzed. Note, that somatic signals are saturated in some cases, in order to optimize the imaging parameters for signal detection in distal dendrite segments.
Figure 5. BDNF–induced increases in protein synthesis
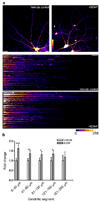
(a) Hippocampal neurons (DIV 16) were incubated for 1 h with 2 mM AHA alone (vehicle control) or 2 mM AHA in the presence of 50 ng/ml BDNF. After a 15 min chase with 2 mM methionine, cells were fixed, tagged with 1 mM fluorescent tag and immunostained for the dendritic marker protein MAP2. For quantitative analysis, dendrites of both groups were straightened and fluorescent intensities of binned 40 µm segments were measured using ImageJ. Representative images for both groups are shown. Color lookup table indicates fluorescence intensity (pixel intensities 0–255). Note the increase in signal intensity in both cell body and dendrites in BDNF–treated versus control cells. Left: proximal; right: distal. Scalebar = 20 µm. (b) Graph shows the change of TRA–signal of BDNF–treated cells ± SEM normalized to controls (vehicle). P–values: *** p < 0.000005; ** p < 0.005; * p < 0.05.
Figure 6. BDNF–induced increase in dendritic protein synthesis
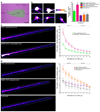
(a) Somata of neurons were perfused with 40µM anisomycin before and during bath-application of 2 mM AHA, or 2 mM AHA + BDNF (50 ng/ml) for 30 min, scalebar = 50 µm. (b) Images showing signals of newly synthesized proteins from nonperfused somata (top left, AHA (I); top right, AHA + BDNF (II)), anisomycin–perfused somata (bottom left, AHA (III); bottom center, AHA + BDNF (IV)) and anisomycin–bath cells (bottom right, (V)). n = 6–9 cells. Large grid tick marks = 20 µm. Graph shows TRA–signal to volume ratios ± SEM. (c,d) Analysis of newly synthesized proteins in dendrites of groups I–IV. Images show signal intensity of representative dendrites beginning at the soma. Left, proximal; right, distal. Color lookup table indicates fluorescence intensity. Note, that somatic signals are saturated in some cases, in order to optimize the imaging parameters for signal detection in distal dendrite segments. Large grid tick marks = 10 µm. Summary graphs shows signal to volume ratios ± SEM. n= 6–9 dendrites. P–values: *** p < 0.001; ** p < 0.01; * p < 0.05, one–way ANOVA with Tukey testing. In graph (c) significance values for group (I) vs. (V) dendrites are indicated in green, for group (II) vs. (V) in magenta, for group (I) vs. (II) dendrites in grey; in graph (d) significance values for group (III) vs. (V) dendrites are indicated in violet, for group (IV) vs. (V) in red, for group (III) vs. (IV) in grey.
Figure 7. Local BDNF–induced increase in dendritic protein synthesis
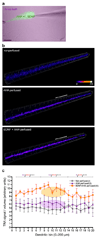
(a) Hippocampal neurons for dendritic local perfusions in combination with anisomycin bath application were pre–incubated in 40 µM anisomycin for 20 min during which time the micropipettes were positioned. Dendritic local perfusion with 2 mM AHA in the presence or absence of BDNF (50 ng/ml) in HibA (with no anisomycin in the perfusion pipette) was initiated, and constantly monitored over the perfusion period of 30 min. Scalebar = 50 µm. Images (b) show TRA signals of representative dendrites from groups (I, top) no perfusion, (II, center) AHA perfusion, (III, bottom) BDNF plus AHA perfusion. Grey bars mark the location and extension of the perfusion stream. Large grid tick marks = 10 µm. Color lookup table indicates fluorescence intensity. Graph (c) shows TRA–signal to volume ratios ± SEM. Colored ovals represent the positions of the perfusion spots. n= 4–5 dendrites. P–values: *** p < 0.001; ** p < 0.01; * p < 0.05 using one–way ANOVA statistical analysis with Tukey testing. Significance values are indicated for the dendritic segments before, within and beyond the perfusion spots; violet labels indicate significances for dendrites derived from group (I) vs. (II), red labels indicate significance values for group (I) vs. (III) dendrites, grey labels indicate significances for group (II) vs. (III) dendrites.
Figure 8. Diffusion properties of newly synthesized proteins at the surface of dissociated primary hippocampal neurons
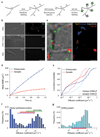
(a) Strategy for labeling newly synthesized proteins inserted in the membrane of living neurons. (b) Neurons were incubated with either 2mM AHA in the presence or the absence of anisomycin, or 2mM Methionine for 2–4 hours and labeled with DIFO–biotin and QD–SA. DIC (left) and QD labeling (right) of live neurons from each condition. Scalebar = 5µm. (c) Example of trajectories of newly synthesized proteins labeled with QDs. Left, DIC and QD labeling (green); active synapses are visualized with FM4–64; right, Individual trajectories reconstructed from QDs. Synaptic (yellow) and extrasynaptic (blue) trajectories were classified in relation to active presynaptic terminals labeled with FM4–64. Scalebar = 2µm. (d) Average MSD of synaptic and extrasynaptic QDs as a function of time. Values are mean ±SEM. (e) Cumulative distribution of newly synthesized proteins diffusion coefficients at (n=101) and outside (n=262) synapses (Kolmogorov–Smirnov test, p<0,001). The diffusion coefficients of the γ2–GABAAR subunit at synapses (n=212) and at extrasynaptic sites (n=77) (KS test, p<0,001) were plotted for comparison. (f) Frequency distribution of extrasynaptic diffusion coefficients of newly synthesized proteins. Colored bars correspond to the 75% of the values (12,5%–87,5% range, black squares correspond to the mode of the distribution) of D values for AMPAR (purple, 50), GABAAR (red), mGluR5 (green, 31,32) and GFP–GPI (grey, 30). (g) Frequency distribution of extrasynaptic diffusion coefficients of γ2–GABAAR. The red bar on the x-axis corresponds to 75% of the values (12,5%–87,5% range) of γ2–GABAAR diffusion coefficients.
Comment in
- Neuronal protein economics: keeping tabs on synthesis.
Ariel P, Ryan TA. Ariel P, et al. Nat Neurosci. 2010 Jul;13(7):781-2. doi: 10.1038/nn0710-781. Nat Neurosci. 2010. PMID: 20581810 No abstract available. - Made locally.
Pastrana E. Pastrana E. Nat Methods. 2010 Aug;7(8):580-1. doi: 10.1038/nmeth0810-580a. Nat Methods. 2010. PMID: 20704016 No abstract available.
Similar articles
- Nitrilase-Activatable Noncanonical Amino Acid Precursors for Cell-Selective Metabolic Labeling of Proteomes.
Li Z, Zhu Y, Sun Y, Qin K, Liu W, Zhou W, Chen X. Li Z, et al. ACS Chem Biol. 2016 Dec 16;11(12):3273-3277. doi: 10.1021/acschembio.6b00765. Epub 2016 Nov 2. ACS Chem Biol. 2016. PMID: 27805363 - Neuronal protein economics: keeping tabs on synthesis.
Ariel P, Ryan TA. Ariel P, et al. Nat Neurosci. 2010 Jul;13(7):781-2. doi: 10.1038/nn0710-781. Nat Neurosci. 2010. PMID: 20581810 No abstract available. - Dopaminergic modulation of the hippocampal neuropil proteome identified by bioorthogonal noncanonical amino acid tagging (BONCAT).
Hodas JJ, Nehring A, Höche N, Sweredoski MJ, Pielot R, Hess S, Tirrell DA, Dieterich DC, Schuman EM. Hodas JJ, et al. Proteomics. 2012 Aug;12(15-16):2464-76. doi: 10.1002/pmic.201200112. Proteomics. 2012. PMID: 22744909 Free PMC article. - Proteomics and pulse azidohomoalanine labeling of newly synthesized proteins: what are the potential applications?
Ma Y, Yates JR 3rd. Ma Y, et al. Expert Rev Proteomics. 2018 Jul;15(7):545-554. doi: 10.1080/14789450.2018.1500902. Epub 2018 Jul 23. Expert Rev Proteomics. 2018. PMID: 30005169 Free PMC article. Review. - Analysis of mRNA translation in cultured hippocampal neurons.
Huang YS, Richter JD. Huang YS, et al. Methods Enzymol. 2007;431:143-62. doi: 10.1016/S0076-6879(07)31008-2. Methods Enzymol. 2007. PMID: 17923234 Review.
Cited by
- Desipramine reverses remote memory deficits by activating calmodulin-CaMKII pathway in a UTX knockout mouse model of Kabuki syndrome.
Chen L, Li Y, Liu M, Lan Z, Zhang X, Yang X, Zhao Q, Wang S, Xu L, Zhou Y, Kuang Y, Suzuki T, Tabuchi K, Takahashi E, Zhou M, Chen CD, Xu T, Li W. Chen L, et al. Gen Psychiatr. 2024 Oct 29;37(5):e101430. doi: 10.1136/gpsych-2023-101430. eCollection 2024. Gen Psychiatr. 2024. PMID: 39493372 Free PMC article. - Altered mRNA transport and local translation in iNeurons with RNA binding protein knockdown.
Dargan R, Mikheenko A, Johnson NL, Packer B, Li Z, Craig EJ, Sarbanes SL, Bereda C, Mehta PR, Keuss M, Nalls MA, Qi YA, Weller CA, Fratta P, Ryan VH. Dargan R, et al. bioRxiv [Preprint]. 2024 Sep 27:2024.09.26.615153. doi: 10.1101/2024.09.26.615153. bioRxiv. 2024. PMID: 39386562 Free PMC article. Preprint. - Translation in Bacillus subtilis is spatially and temporally coordinated during sporulation.
Iwańska O, Latoch P, Kopik N, Kovalenko M, Lichocka M, Serwa R, Starosta AL. Iwańska O, et al. Nat Commun. 2024 Aug 21;15(1):7188. doi: 10.1038/s41467-024-51654-6. Nat Commun. 2024. PMID: 39169056 Free PMC article. - Cracking the Code: Reprogramming the Genetic Script in Prokaryotes and Eukaryotes to Harness the Power of Noncanonical Amino Acids.
Jann C, Giofré S, Bhattacharjee R, Lemke EA. Jann C, et al. Chem Rev. 2024 Sep 25;124(18):10281-10362. doi: 10.1021/acs.chemrev.3c00878. Epub 2024 Aug 9. Chem Rev. 2024. PMID: 39120726 Review. - Translational control in the spinal cord regulates gene expression and pain hypersensitivity in the chronic phase of neuropathic pain.
Lister KC, Wong C, Uttam S, Parisien M, Stecum P, Brown N, Cai W, Hooshmandi M, Gu N, Amiri M, Beaudry F, Jafarnejad SM, Tavares-Ferreira D, Inturi NN, Mazhar K, Zhao HT, Fitzsimmons B, Gkogkas CG, Sonenberg N, Price TJ, Diatchenko L, Atlasi Y, Mogil JS, Khoutorsky A. Lister KC, et al. bioRxiv [Preprint]. 2024 Jun 28:2024.06.24.600539. doi: 10.1101/2024.06.24.600539. bioRxiv. 2024. PMID: 38979173 Free PMC article. Preprint.
References
- Sutton MA, Schuman EM. Dendritic protein synthesis, synaptic plasticity, and memory. Cell. 2006;127:49–58. - PubMed
- Nguyen PV, Abel T, Kandel ER. Requirement of a critical period of transcription for induction of a late phase of LTP. Science. 1994;265:1104–1107. - PubMed
- Bito H, Deisseroth K, Tsien RW. CREB phosphorylation and dephosphorylation: a Ca(2+)- and stimulus duration-dependent switch for hippocampal gene expression. Cell. 1996;87:1203–1214. - PubMed
- Casadio A, et al. A transient, neuron-wide form of CREB-mediated long-term facilitation can be stabilized at specific synapses by local protein synthesis. Cell. 1999;99:221–237. - PubMed
- Kang H, Schuman EM. A requirement for local protein synthesis in neurotrophin-induced hippocampal synaptic plasticity. Science. 1996;273:1402–1406. - PubMed
Publication types
MeSH terms
Substances
Grants and funding
- HHMI/Howard Hughes Medical Institute/United States
- R01 GM062523/GM/NIGMS NIH HHS/United States
- R21 DA020589-02/DA/NIDA NIH HHS/United States
- R21 DA020589-01/DA/NIDA NIH HHS/United States
- R21 DA020589/DA/NIDA NIH HHS/United States
LinkOut - more resources
Full Text Sources
Other Literature Sources
