Deleterious effects of amyloid beta oligomers acting as an extracellular scaffold for mGluR5 - PubMed (original) (raw)
Comparative Study
Deleterious effects of amyloid beta oligomers acting as an extracellular scaffold for mGluR5
Marianne Renner et al. Neuron. 2010.
Abstract
Soluble oligomers of amyloid beta (Abeta) play a role in the memory impairment characteristic of Alzheimer's disease. Acting as pathogenic ligands, Abeta oligomers bind to particular synapses and perturb their function, morphology, and maintenance. Events that occur shortly after oligomer binding have been investigated here in live hippocampal neurons by single particle tracking of quantum dot-labeled oligomers and synaptic proteins. Membrane-attached oligomers initially move freely, but their diffusion is hindered markedly upon accumulation at synapses. Concomitantly, individual metabotropic glutamate receptors (mGluR5) manifest strikingly reduced lateral diffusion as they become aberrantly clustered. This clustering of mGluR5 elevates intracellular calcium and causes synapse deterioration, responses prevented by an mGluR5 antagonist. As expected, clustering by artificial crosslinking also promotes synaptotoxicity. These results reveal a mechanism whereby Abeta oligomers induce the abnormal accumulation and overstabilization of a glutamate receptor, thus providing a mechanistic and molecular basis for Abeta oligomer-induced early synaptic failure.
Copyright 2010 Elsevier Inc. All rights reserved.
Figures
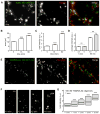
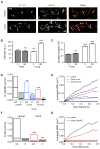
Figure 1. Aβ Oligomers Bind to Excitatory Synapses
(A) Labeling of Homer1b/c (red) and gephyrin (blue) in neurons incubated for 5 min with b-Aβo (500 nM). b-Aβo were labeled with streptavidin (green). Bar: 2 μm. (B) Quantification of colocalization between b-Aβo and Homer or gephyrin normalized to the relative proportion of each kind of synapse (mean ± SEM; t test, ***p < 0.0001; n = 13 neurites). (C) Detail of the square indicated in (A) showing in separate channels the immunoreactivity of Homer (arrows) and Gephyrin (triangles) and the labeling of b-Aβo (top panels). Bottom panels show merge images of b-Aβo and Homer (left) or Gephyrin (right) and the triple merging (center). Bar: 1 μm.
Figure 2. Aβ Oligomers Are Recruited in Aggregates by Means of Lateral Diffusion
(A) Labeling of b-Aβo (left) and synapses (FM4-64; middle) in living neurons after 5 min of b-Aβo application (500 nM). Right image shows the merging of both. Bar: 1 μm. (B and C) Time dependence of b-Aβo cluster surface area (B) and total intensity (C) (mean ± SEM; 30 neurites; t test, ***p < 0.0001). (D) b-Aβo average intensity at (in) or outside (out) synapses (mean ± SEM; 30 neurites; t test, **p < 0.01). (E) Immunostaining of synapsin (middle) in neurons treated with TAMRA-Aβo (100 nM; left) for 1 min. Right image shows the merging of both. Bar: 1 μm. (F and G) TAMRA-Aβo were applied for 1 min (100 nM) and neurons were observed at the indicated times after rinsing. Note that TAMRA-Aβo cluster fluorescence intensity increases progressively (quantified in G) even if there are no more oligomers in the cell medium. Bar: 1 μm. (G) Quantification of TAMRA-Aβo fluorescence intensity (box: median, 25%, and 75% interquartiles; n = 676–2382 clusters; MW, ***p < 0.0001).
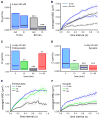
Figure 3. Aβ Oligomers Diffusing Laterally in the Plasma Membrane Are Slowed Down by Their Clustering
(A and B) Influence of incubation time on lateral diffusion properties of Aβo. (A) Diffusion coefficient D for trajectories at (in) and outside (out) synapses after 5 min (blue boxes) or 60 min (white boxes) of Aβo application (median, 25%, and 75% interquartiles; KS test, ***p < 0.0001). (B) Averaged MSD (mean ± SEM) plot for the same trajectories analyzed in (A), extrasynaptic (solid lines) or synaptic (broken lines). (C and D) Diffusion coefficient D at extrasynaptic (C) and synaptic (D) membranes after continuous (5, 15, and 60 min) or pulsed (5 min and observed at 60 min; 5 + 60) b-Aβo application at low concentration (20 nM). Note that D decreases with incubation time and pulsed treatment has an effect only at synapses (median, 25%, and 75% interquartiles. KS test, **p < 0.01, ***p < 0.0001). (E and F) Averaged MSD (mean ± SEM) plot of the trajectories analyzed in (C) and (D) for times of treatment 5, 15, and 60 min.
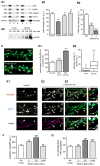
Figure 4. Aβ Oligomers Increase the Clustering of mGluR5 and Its Localization at Synapses
(A1) Coisolation of selected synaptic proteins from synaptosomes treated with Aβo (A) or vehicle (V) labeled with anti-Aβo (NU-2) and immunoprecipitated with anti-mouse IgG Dynabeads (S, total synaptosome protein; V and A, eluted fractions). (A2) Western blot depicting the mGluR5 immunoreactivity in Triton-resistant DOC extractable fraction of neurons treated with Aβo at various concentrations (52, 125, and 300 nM) for 5 or 60 min. (B1) Aβo total intensity in neurons preincubated with antibodies raised against an extracellular epitope of mGluR5 (mGR5), mGluR1 (mGR1), or mGluR2 (mGR2) prior to a treatment with 500 nM FAM-Aβo (mean ± SEM; n = 25–50 dendritic regions; ANOVA, **p < 0.001). (B2) FAM-Aβo total intensity in neurons from wild-type (WT), heterozygous (+/−), or homozygous (−/−) mGluR5 KO mice (mean ± SEM; n = 64–175 dendritic regions; ANOVA, ***p < 0.001). (C) Fluorescence of Venus-tagged mGluR5a (mGluR5-Ve; green) in control neurons or after 60 min of application of HiLyte555-tagged Aβo (Hi-Aβo; red). Bar: 2 μm. (D1 and D2) Quantification of enrichment of mGluR5-Ve (D1) or total intensity of Hi- Aβo (D2) in spines in control (No Aβo) or Hi-Aβo-treated neurons (Aβo 5 or 60 min; median, 25%, and 75% IQR and 5%–95% confidence intervals; n = 194–776 spines on 25–43 cells; t test, ***p < 0.0001). (E1–E3) Immunostaining of mGluR5 (top line) and synapses (vGluT1; middle line) in control (E1) or Aβo-treated (E2 and E3) neurons (b-Aβo 60 min; 500 nM). b-Aβo and mGluR5 staining were performed in nonpermeabilizing conditions. Arrows indicate synaptic mGluR5 clusters. Bar: 2 μm. (E1 and E2) Bottom line shows the merging of mGluR5 (red) and vGluT1 (blue). (E3) (Top) Merging of mGluR5 (red) and b-Aβo (green). (Center) Merging of b-Aβo (green) and vGluT1 (blue). (Bottom) Triple merging. Right column shows the magnification of the area indicated by the white rectangle. Triangles indicate mGluR5 clusters that colocalize with b-Aβo outside synapses. (F) Quantification of total intensity of mGluR5 in the absence of b-Aβo (no b-Aβo) or after continuous (5 or 60 min) or pulsed (5 min observed at 60 min; 5 + 60) b-Aβo application (mean ± SEM; n = 25–50 cells; t test, **p < 0.001, ***p < 0.0001; ns, not significant). (G) Colocalization of mGluR5 and vGluT1 immunoreactive clusters in the same conditions as in (F) (mean ± SEM; n = 25–50 cells; t test, ***p < 0.0001).
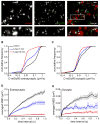
Figure 5. Aβ Oligomers Decrease mGluR5 Lateral Diffusion
(A) Labeling of b-Aβo (left) and mGluR5 (center) and merging of both (right) in living neurons. Cells were incubated first with b-Aβo for 60 min (500 nM) and then with anti-mGluR5 (10 min). Arrows indicate spots of mGluR5 (green) colocalized with b-Aβo (red). (Bottom) Higher magnification of the area indicated by the white rectangle. Bar: 1 μm (top) or 0.5 μm (bottom). (B and C) Diffusion coefficients D for QD-mGluR5 trajectories on extrasynaptic (B) and synaptic (C) membranes in control cells (black) or after application of Aβo (b-Aβo; 500 nM) for 5 (blue) or 60 (red) min. (D and E) Averaged MSD (mean ± SEM) plots of the same trajectories analyzed in (B) and (C) at extrasynaptic areas (D) and at synapses (E). Same color coding as in (B) and (C). Note that the amplitude of the effects depends on the duration of application.
Figure 6. Effect of Crosslinking of mGluR5 on Its Distribution and Mobility
(A) Coimmunodetection of mGluR5 (left) and synapses (vGluT1; center) in control conditions or after 60 min of crosslinking of mGluR5 with an anti-mGluR5 antibody (X-link). Right images show the merging of both. Bar: 2 μm. (B) Total fluorescence intensity of mGluR5 after 5 min (n = 17 cells) or 60 min (n = 15) of X-link (mean ± SEM). Neurons were incubated with streptavidin for the indicated times before (living) or after (fixed) fixation (mean ± SEM; t test, ***p < 0.0001; ns, not significant). (C) Percentage of mGluR5 clusters colocalized with vGluT1 after 5 min (n = 17) or 60 min (n = 15) of X-link (mean ± SEM). Neurons were incubated as in (B) (t test, ***p < 0.0001; ns, not significant). (D) Diffusion coefficient D for mGluR5 trajectories at (in) and outside (out) synapses in neurons without (black) or after 5 (blue) or 60 (red) min of X-link (median, 25%, and 75% interquartiles; KS test, **p < 0.001, ***p < 0.0001). (E) Averaged MSD plots of the same trajectories analyzed in (D) (same color coding as in D) at (broken lines) and outside (solid lines) synapses. (F and G) Neurons were treated first with unmodified Aβo (5 min, 20 nM) and mGluR5s were cross-linked with antibodies and streptavidin for 60 min. (F) Diffusion coefficient D for Aβo trajectories at (in) and outside (out) synapses in control cells (black) or after 60 min of crosslinking of mGluR5 (red) (median, 25%, and 75% interquartiles; KS test, ***p < 0.0001). (G) Average MSD plot of the same trajectories analyzed in (F) (same color coding as in F) at (broken lines) or outside (solid lines) synapses.
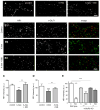
Figure 7. Decrease of NMDAR (NR1) at Synapses after Aβ Oligomer Treatment or Crosslinking of mGluR5
(A and B) NR1 fluorescence (NR1-IR) in control conditions, after Aβo application (A, Aβo) or mGluR5 crosslinking (B, X-link) for 60 min. NR1 staining was performed in nonpermeabilizing conditions. Mean ± SEM. Bar: 2 μm. (A) Note that Aβo-associated NR1-IR reduction is prevented by an mGluR5 antagonist (Aβo + SIB). (B) Double immunolocalization of NR1 and vGluT1 in control (B1), after mGluR5 X-link (B2) or after X-link together with SIB (B3). (C) Quantification of NR1-IR intensity in the experiments illustrated in (A) (control: 118 ± 6 a.u.; b-Aβo 60 min: 83 ± 5; b-Aβo + SIB: 122 ± 11; t test, **p < 0.01, ***p < 0.001; n = 15 cells). (D) Quantification of NR1-IR intensity in the experiments illustrated in (B) (control: 110 ± 14 a.u.; X-link 60 min: 76 ± 8; X-link + SIB: 95 ± 4; t test, **p < 0.001, ***p < 0.0001; n = 15 cells). (E) Quantification of NR1-IR intensity in neurons from wild-type (WT), heterozygous (+/−), or homozygous (−/−) mGluR5 KO mice in control conditions (C) or after 3 hr of incubation with Aβo (mean ± SEM; n = 104–605 dendritic regions; ANOVA, *p < 0.05, ***p < 0.001).
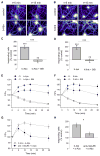
Figure 8. Aβ Oligomers and Crosslinking of mGluR5 Impact on Intracellular Calcium
Ca2+i monitored by fluorescence intensity of Fluo4AM on neurons treated with Aβo (A, C, and E) or after mGluR5 crosslinking (B, D, and F). Mean ± SEM. (A and B) Examples of cells (Fluo4 intensity in pseudo-color). (C and D) Percentage of “responding” neurons (that increased Fluo4AM intensity during the recordings) over control conditions. (C) Neurons treated with Aβo (500 nM) or Aβo and SIB (Aβo + SIB; t test, ***p > 0.0001; n = 16–22 fields of observation). (D) Neurons after mGluR5 X-link or after X-link and SIB (t test, ***p > 0.0001; n = 15–34 fields of observation). (E and F) Fluo4AM fluorescence intensity over time (F/Fo; mean ± SEM) of cells where the intensity increased (“responding”; black symbols) or not (“not responding”; white symbols). (E) Cells treated with Aβo (circles) and with Aβo + SIB 1757 (squares) (n = 21–105 cells). (F) Cells after X-link of mGluR5 and without (circles) or with SIB 1757 (squares) (n = 27–127 cells). (G and H) Neurons were treated for mGluR5 cross-linking and with Aβo (500 nM; X-link + Aβo) or they were incubated with an anti-mGluR5 antibody prior to Aβo application (anti-mGluR5 + Aβo). (G) Fluo4AM fluorescence intensity over time (F/Fo; mean ± SEM) of responding neurons treated with mGluR5 X-link + Aβo (black triangles) or with anti-mGluR5 antibody + Aβo (white triangles) (n = 44–62 cells). (H) Percentage of responding neurons treated as in (G) (percentage over control conditions; t test, p = 0.030; n = 10–20 fields of observation).
Similar articles
- β-amyloid and ATP-induced diffusional trapping of astrocyte and neuronal metabotropic glutamate type-5 receptors.
Shrivastava AN, Kowalewski JM, Renner M, Bousset L, Koulakoff A, Melki R, Giaume C, Triller A. Shrivastava AN, et al. Glia. 2013 Oct;61(10):1673-86. doi: 10.1002/glia.22548. Epub 2013 Aug 6. Glia. 2013. PMID: 23922225 - Metabotropic glutamate receptor 5 is a coreceptor for Alzheimer aβ oligomer bound to cellular prion protein.
Um JW, Kaufman AC, Kostylev M, Heiss JK, Stagi M, Takahashi H, Kerrisk ME, Vortmeyer A, Wisniewski T, Koleske AJ, Gunther EC, Nygaard HB, Strittmatter SM. Um JW, et al. Neuron. 2013 Sep 4;79(5):887-902. doi: 10.1016/j.neuron.2013.06.036. Neuron. 2013. PMID: 24012003 Free PMC article. - Pathogenesis of Abeta oligomers in synaptic failure.
Sivanesan S, Tan A, Rajadas J. Sivanesan S, et al. Curr Alzheimer Res. 2013 Mar;10(3):316-23. doi: 10.2174/1567205011310030011. Curr Alzheimer Res. 2013. PMID: 23036017 Review. - Beta-amyloid oligomers affect the structure and function of the postsynaptic region: role of the Wnt signaling pathway.
Dinamarca MC, Colombres M, Cerpa W, Bonansco C, Inestrosa NC. Dinamarca MC, et al. Neurodegener Dis. 2008;5(3-4):149-52. doi: 10.1159/000113687. Epub 2008 Mar 6. Neurodegener Dis. 2008. PMID: 18322375 Review.
Cited by
- Assessment of the relationship between synaptic density and metabotropic glutamate receptors in early Alzheimer's disease: a multi-tracer PET study.
Salardini E, O'Dell RS, Tchorz E, Nabulsi NB, Huang Y, Carson RE, van Dyck CH, Mecca AP. Salardini E, et al. bioRxiv [Preprint]. 2024 Sep 24:2024.09.21.614277. doi: 10.1101/2024.09.21.614277. bioRxiv. 2024. PMID: 39386453 Free PMC article. Preprint. - Tau reduction prevents Aβ-induced axonal transport deficits by blocking activation of GSK3β.
Vossel KA, Xu JC, Fomenko V, Miyamoto T, Suberbielle E, Knox JA, Ho K, Kim DH, Yu GQ, Mucke L. Vossel KA, et al. J Cell Biol. 2015 May 11;209(3):419-33. doi: 10.1083/jcb.201407065. J Cell Biol. 2015. PMID: 25963821 Free PMC article. - Phosphoinositides: Two-Path Signaling in Neuronal Response to Oligomeric Amyloid β Peptide.
Uranga RM, Alza NP, Conde MA, Antollini SS, Salvador GA. Uranga RM, et al. Mol Neurobiol. 2017 Jul;54(5):3236-3252. doi: 10.1007/s12035-016-9885-3. Epub 2016 Apr 14. Mol Neurobiol. 2017. PMID: 27080543 - Postsynaptic Receptors for Amyloid-β Oligomers as Mediators of Neuronal Damage in Alzheimer's Disease.
Dinamarca MC, Ríos JA, Inestrosa NC. Dinamarca MC, et al. Front Physiol. 2012 Dec 20;3:464. doi: 10.3389/fphys.2012.00464. eCollection 2012. Front Physiol. 2012. PMID: 23267328 Free PMC article. - Chronic low-dose-rate ionising radiation affects the hippocampal phosphoproteome in the ApoE-/- Alzheimer's mouse model.
Kempf SJ, Janik D, Barjaktarovic Z, Braga-Tanaka I 3rd, Tanaka S, Neff F, Saran A, Larsen MR, Tapio S. Kempf SJ, et al. Oncotarget. 2016 Nov 1;7(44):71817-71832. doi: 10.18632/oncotarget.12376. Oncotarget. 2016. PMID: 27708245 Free PMC article.
References
- Abdalla S, Lother H, El Missiry A, Langer A, Sergeev P, El Faramawy Y, Quitterer U. Angiotensin II AT2 receptor oligomers mediate G-protein dysfunction in an animal model of Alzheimer disease. J Biol Chem. 2008;284:6554–6565. - PubMed
- Bannai H, Levi S, Schweizer C, Dahan M, Triller A. Imaging the lateral diffusion of membrane molecules with quantum dots. Nat Protoc. 2006;1:2628–2634. - PubMed
- Bannai H, Levi S, Schweizer C, Inoue T, Launey T, Racine V, Sibarita JB, Mikoshiba K, Triller A. Activity-dependent tuning of inhibitory neurotransmission based on GABAAR diffusion dynamics. Neuron. 2009;62:670–682. - PubMed
- Benarroch EE. Metabotropic glutamate receptors: synaptic modulators and therapeutic targets for neurologic disease. Neurology. 2008;70:964–968. - PubMed
Publication types
MeSH terms
Substances
Grants and funding
- R01 AG029460/AG/NIA NIH HHS/United States
- R01 NS058894/NS/NINDS NIH HHS/United States
- R01 NS058894-03/NS/NINDS NIH HHS/United States
- R01AG029460/AG/NIA NIH HHS/United States
LinkOut - more resources
Full Text Sources
Other Literature Sources
Research Materials

