Enhancement of transport selectivity through nano-channels by non-specific competition - PubMed (original) (raw)
Enhancement of transport selectivity through nano-channels by non-specific competition
Anton Zilman et al. PLoS Comput Biol. 2010.
Abstract
The functioning of living cells requires efficient and selective transport of materials into and out of the cell, and between different cellular compartments. Much of this transport occurs through nano-scale channels that do not require large scale molecular re-arrangements (such as transition from a 'closed' to an 'open' state) and do not require a direct input of metabolic energy during transport. Nevertheless, these 'always open' channels are highly selective and pass only their cognate molecules, while efficiently excluding all others; indeed, these channels can efficiently transport specific molecules even in the presence of a vast excess of non-specific molecules. Such biological transporters have inspired the creation of artificial nano-channels. These channels can be used as nano-molecular sorters, and can also serve as testbeds for examining modes of biological transport. In this paper, we propose a simple kinetic mechanism that explains how the selectivity of such 'always open' channels can be based on the exclusion of non-specific molecules by specific ones, due to the competition for limited space inside the channel. The predictions of the theory account for the behavior of the nuclear pore complex and of artificial nanopores that mimic its function. This theory provides the basis for future work aimed at understanding the selectivity of various biological transport phenomena.
Conflict of interest statement
The authors have declared that no competing interests exist.
Figures
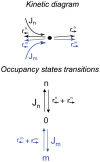
Figure 1. Kinetic scheme of a ‘one-site’ channel.
Top. Two species of particles, m and n, enter the channel with fluxes  and
and  , if the channel is not occupied. Upon entry, they can either hop forward with rates
  or
or  respectively, or hop backwards with rates
  and
and  , respectively. Bottom. Alternative occupancy representation of the transport kinetics as transitions between the three possible occupancy states: occupied by an
  -type particle, or occupied by an
  -type particle, or unoccupied.
Figure 2. Kinetic scheme of transport through an N-site channel.
A. The channel is represented as a chain of  positions. The blue arrows denote the transition rates of the particles of species
  , which enter the channel at a position
  with an average rate
  , if its occupancy is smaller than the maximal allowed. The black arrows denote the transition rates of particles of species
  that also enter at site
  with an average rate
  . B. The kinetic profile example used for the simulations presented in Fig. 4. One species (m) of particles – shown in blue - interacts weakly with the channel, and is trapped inside only weakly. The otherspecies of particles (n) – shown in black – is strongly (but transiently) trapped in the channel, as modeled by lower exit rate
  and higher ingress rate
  near the channel entrance at position 2.
Figure 3. Transport efficiencies and probabilities for a single species.
Transport efficiency (black line) and translocation probability (dotted line) for single species (say, _n_-species in the absence of m-species) as a function of the trapping strength , for J/r = 0.01. The transient trapping increases the probability that the particles translocate through the channel after they have entered (dotted line). This leads to an accompanying increase in transport efficiency; however for trapping that is too strong, particles residing in the channel prevent the entrance of new ones and transport efficiency decreases.
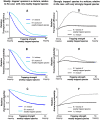
Figure 4. Selectivity enhancement in a mixture of two species.
The left panels describe the transport of a weakly trapped species in a titrated mixture with the strongly trapped species, relative to the case when only a weakly trapped species is present. The right panels describe the transport of a strongly trapped species in the same mixture relative to the case when only a strongly trapped species is present. In all panels the total combined flux of the particles is  ; log-linear scale in all panels. Transport of weakly trapped particles is inhibited by competition with more strongly trapped ones: panels A, B, C. (A) Efficiency of transport of the weakly trapped species (m) in competition with the strongly trapped species (n), relative to the case when the weakly trapped species is present alone in the same concentration,
  (B) Probability of translocation through the channel of a particle of the weakly trapped species, relative to the case when they it is present alone in the same concentration,
  . (C) Probability to enter the channel of the weakly trapped species, relative to the case when it is present alone in the same concentration,
  . In all panels A, B, C, the blue line represents 1∶1 mixture (
 ) and the turqouise line represents 9∶1 excess of the weakly trapped particles (
 ). Transport of the strongly trapped species is enhanced by competition with athe weakly trapped species: panels D, E, F. (D) Efficiency of transport of the strongly trapped species (n) in competition with the weakly trapped ospecies (m), relative to the case when the strongly trapped species is present alone in the same concentration,
  . (E) Probability of translocation through the channel of the weakly trapped species, relative to the case when it is present alone in the same concentration,
  . (F) Probability to enter the channel of the weakly trapped species, relative to the case when it is present alone in the same concentration,
  . In all panels D, E, F, the black line represents 1∶1 mixture (
 ) and the gray line represents 9∶1 excess of the weakly trapped particles (
 ).
).
Figure 5. Competition inhibits the transport of the weakly trapped species even in wide channels.
Ratio of the transport of the weakly trapped species to that of the strongly trapped species with competition, normalized by the ratio of the single-species efficiencies; black line: equal mixture ( ) for a channel accommodating up to one particle at each site gray line: 9-fold excess of the weakly trapped species (
 ) for a channel accommodating up to one particle at each site,
  red line: channel accommodating up to two particles at each site (maximal local occupancy
  ), red dotted line : channel can accommodate up to three particles at each site (
 ). The selectivity enhancement decreases with the channel width; J = 0.01r.
Figure 6. Selectivity enhancement increases with the channel length.
Ratio of the transport selectivity of a weakly trapped species to that of a strongly trapped species, as a function of the channel length,  .
.
Figure 7. Effect of addition of weakly trapped species on the transport of the strongly trapped species.
Relative transport efficiency  of the strongly trapped species (for
  and
and  ) as a function of the trapping strength of the added weakly trapped species, when the latter are added in the same concentration
  (black) or in tenfold excess
  (gray) in the same kinetic profile as in Figs. 3, 4, and 5 (shown in Fig. 2). Addition of the weakly trapped species enhances the transport of the strongly trapped species – see text for discussion. Inset: density profile of the specific (red) and non-specific (blue) particles from the channel entrance to the exit for strong (left), intermediate (middle) and (weak) trapping of the non-specific particles present in ten-fold excess.
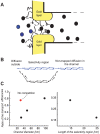
Figure 8. Comparison with experimental data.
Panel A: schematic illustration of the experimental setup of Ref. . The filamentous proteins (FG -nups) naturally lining the NPC are grafted to the gold layer at the channel opening, thus creating a trapping region, where the specific (NTF2-GST, black circles) and non-specific (BSA, blue circles) molecules compete for space. Approximate diameter of the channel is 33 nm, 50 nm, or 100 nm in different experiments, the Stokes radius of the molecules of both species is ∼3.5 nm. The length of the trapping region is either ∼15 or ∼25 nm. Panel B: schematic mapping of the actual channel onto a theoretical model. Panel C: Brief summary of the experimental findings of Ref. . This panel shows the ratio of the transport efficiency of the non-binding control protein (BSA) to the transport efficiency of the transport factor NTF2-GST (that binds the FG-nup filaments) for different widths and lengths of the trapping region (normalized by their flux through a non-functionalized channel). In accord with the theoretical predictions, the presence of the specific transport factor inhibits the transport of the non-specific protein and the magnitude of this inhibition decreases with the channel width and increases with the length of the trapping region.
Similar articles
- Effects of multiple occupancy and interparticle interactions on selective transport through narrow channels: theory versus experiment.
Zilman A. Zilman A. Biophys J. 2009 Feb 18;96(4):1235-48. doi: 10.1016/j.bpj.2008.09.058. Biophys J. 2009. PMID: 19217844 Free PMC article. - Macromolecular crowding: chemistry and physics meet biology (Ascona, Switzerland, 10-14 June 2012).
Foffi G, Pastore A, Piazza F, Temussi PA. Foffi G, et al. Phys Biol. 2013 Aug;10(4):040301. doi: 10.1088/1478-3975/10/4/040301. Epub 2013 Aug 2. Phys Biol. 2013. PMID: 23912807 - Effects of jamming on nonequilibrium transport times in nanochannels.
Zilman A, Pearson J, Bel G. Zilman A, et al. Phys Rev Lett. 2009 Sep 18;103(12):128103. doi: 10.1103/PhysRevLett.103.128103. Epub 2009 Sep 17. Phys Rev Lett. 2009. PMID: 19792464 Free PMC article. - Emerging issues of connexin channels: biophysics fills the gap.
Harris AL. Harris AL. Q Rev Biophys. 2001 Aug;34(3):325-472. doi: 10.1017/s0033583501003705. Q Rev Biophys. 2001. PMID: 11838236 Review. - Asymmetric ion transport through ion-channel-mimetic solid-state nanopores.
Guo W, Tian Y, Jiang L. Guo W, et al. Acc Chem Res. 2013 Dec 17;46(12):2834-46. doi: 10.1021/ar400024p. Epub 2013 May 28. Acc Chem Res. 2013. PMID: 23713693 Review.
Cited by
- Surface functionalities of gold nanoparticles impact embryonic gene expression responses.
Truong L, Tilton SC, Zaikova T, Richman E, Waters KM, Hutchison JE, Tanguay RL. Truong L, et al. Nanotoxicology. 2013 Mar;7(2):192-201. doi: 10.3109/17435390.2011.648225. Epub 2012 Jan 20. Nanotoxicology. 2013. PMID: 22263968 Free PMC article. - Design principles of selective transport through biopolymer barriers.
Maguire L, Stefferson M, Betterton MD, Hough LE. Maguire L, et al. Phys Rev E. 2019 Oct;100(4-1):042414. doi: 10.1103/PhysRevE.100.042414. Phys Rev E. 2019. PMID: 31770897 Free PMC article. - Physics of the Nuclear Pore Complex: Theory, Modeling and Experiment.
Hoogenboom BW, Hough LE, Lemke EA, Lim RYH, Onck PR, Zilman A. Hoogenboom BW, et al. Phys Rep. 2021 Jul 25;921:1-53. doi: 10.1016/j.physrep.2021.03.003. Epub 2021 Mar 24. Phys Rep. 2021. PMID: 35892075 Free PMC article. - The Multiple Faces of Disordered Nucleoporins.
Lemke EA. Lemke EA. J Mol Biol. 2016 May 22;428(10 Pt A):2011-24. doi: 10.1016/j.jmb.2016.01.002. Epub 2016 Jan 11. J Mol Biol. 2016. PMID: 26791761 Free PMC article. Review. - Diameter dependence of transport through nuclear pore complex mimics studied using optical nanopores.
Klughammer N, Barth A, Dekker M, Fragasso A, Onck PR, Dekker C. Klughammer N, et al. Elife. 2024 Feb 20;12:RP87174. doi: 10.7554/eLife.87174. Elife. 2024. PMID: 38376900 Free PMC article.
References
- Alberts Mea. Molecular Biology of the Cell: Garland Publishing. 1994
- Stein W. Channels, Carriers, and Pumps: An Introduction to Membrane Transport. 1990
- Hohmann S, Nielsen S, Agre P. Aquaporins: Academic Press; 2001.
- de Groot BL, Grubmuller H. Water Permeation Across Biological Membranes: Mechanism and Dynamics of Aquaporin-1 and GlpF. Science. 2001;294:2353–2357. - PubMed
Publication types
MeSH terms
Substances
Grants and funding
- P41 RR000862/RR/NCRR NIH HHS/United States
- GM062427/GM/NIGMS NIH HHS/United States
- RR00862/RR/NCRR NIH HHS/United States
- GM071329/GM/NIGMS NIH HHS/United States
- R01 GM071329/GM/NIGMS NIH HHS/United States
- R01 GM062427/GM/NIGMS NIH HHS/United States
LinkOut - more resources
Full Text Sources


