Coexpression of PD-1, 2B4, CD160 and KLRG1 on exhausted HCV-specific CD8+ T cells is linked to antigen recognition and T cell differentiation - PubMed (original) (raw)
Coexpression of PD-1, 2B4, CD160 and KLRG1 on exhausted HCV-specific CD8+ T cells is linked to antigen recognition and T cell differentiation
Bertram Bengsch et al. PLoS Pathog. 2010.
Abstract
Exhausted CD8+ T cell responses during chronic viral infections are defined by a complex expression pattern of inhibitory receptors. However, very little information is currently available about the coexpression patterns of these receptors on human virus-specific CD8+ T cells and their correlation with antiviral functions, T cell differentiation and antigen recognition. We addressed these important aspects in a cohort of 38 chronically HCV infected patients and found a coexpression of inhibitory receptors such as 2B4, CD160 and KLRG1 in association with PD-1 in about half of the HCV-specific CD8+ T cell responses. Importantly, this exhaustive phenotype was associated with low and intermediate levels of CD127 expression, an impaired proliferative capacity, an intermediate T cell differentiation stage and absence of sequence variations within the corresponding epitopes, indicating ongoing antigen triggering. In contrast, a low expression of inhibitory receptors by the remaining HCV-specific CD8+ T cells occurred in concert with a CD127hi phenotype, an early T cell differentiation stage and presence of viral sequence variations within the corresponding epitopes. In sum, these results suggest that T cell exhaustion contributes to the failure of about half of HCV-specific CD8+ T cell responses and that it is determined by a complex interplay of immunological (e.g. T cell differentiation) and virological (e.g. ongoing antigen triggering) factors.
Conflict of interest statement
The authors have declared that no competing interests exist.
Figures
Figure 1. Expression of various inhibitory receptors by HCV-specific CD8+ T cells.
The expression of PD-1, 2B4, CD160, KLRG1, CTLA-4 and LAG-3 was monitored on HCV-specific CD8+ T cell responses targeting multiple immunodominant HCV epitopes of 10 consecutive patients and compared to the expression of these receptors on virus-specific CD8+ T cells targeting an immunodominant Influenza matrix epitope. Mean expression and SEM of each inhibitory receptor on virus-specific CD8+ T cells is shown.
Figure 2. Expression of PD-1, 2B4, CD160 and KLRG1 on HCV-specific CD8+ T cells.
(A) Frequency of inhibitory receptor expression on HCV-specific CD8+ T cells. Each dot represents inhibitory receptor expression on epitope-specific CD8+ T cells. Median expression of inhibitory receptors in the study cohort was 88,9% (PD-1), 62,0% (2B4), 7,4% (CD160), and 40,8% (KLRG1). (B) Representative tetramer stainings chosen to depict approximately the median inhibitory receptor expression of the total cohort. Plots are displayed using biexponential transformation (FlowJo 8.8.6).
Figure 3. Inhibitory receptor expression is inversely linked to level of CD127 expression.
(A) Three groups of HCV-specific CD8+ T cell responses can be distinguished by level of CD127 expression. High levels of CD127 expression (>80%) are displayed by black circles, intermediate levels of CD127 (50–80%) by grey circles and a low expression of CD127 (<50%) by white circles. (B) Expression of inhibitory receptors PD-1, 2B4, CD160 and KLRG1 is shown for CD127hi (black circles), CD127mid (grey circles) and CD127lo (white circles) HCV-specific CD8+ T cells. Significant differences of inhibitory receptor expression between the CD127 subgroups were observed for PD-1 expression (p<0.0001), 2B4 expression (p<0.0001), CD160 expression (p<0.05) and KLRG1 expression (p<0.0001). (C) Coexpression of inhibitory receptors on HCV-specific CD8+ T cells on a single-cell-level. Displayed is the frequency of HCV-specific CD8+ T cells within a given epitope expressing 0 (white), 1 (light grey), 2 (grey), 3 (dark grey) or 4 (black) inhibitory receptors. Representative diagrams are shown for a CD127hi epitope (pt. 4-NS3-1406), CD127mid epitope (pt. 26-NS3-1406) and CD127lo epitope (pt. 4-NS5-2594). Coexpression of inhibitory receptors inversely correlates with CD127 expression.
Figure 4. Proliferative capacity and exhaustion inversely correlate with CD127 expression.
Proliferation of HCV-specific CD8+ T cells upon peptide stimulation in the presence or absence of PD-L1 blockade was measured by reduction in PBSE fluorescence in short term cultures of 15 patients. Representative stainings are shown for (A) CD127lo (pt.4-NS5-2594), (B) CD127mid (pt. 13-NS3-1073) and (C) CD127hi (pt. 32-NS5-2594) HCV-specific CD8+ T cells. (D) Comparison of the increase in proliferation depending on PD-L1 blockade. Depicted are the mean values and SEM for the ratio (frequency of HCV-specific CD8+ T cells after peptide stimulation and PD-L1 blockade/frequency of HCV-specific CD8+ T cells after peptide stimulation). This ratio reflects the effect of PD-L1 blockade in addition to peptide stimulation. PD-L1 blockade in the cohort analyzed was significantly more effective for peptide-stimulated CD127lo cells (mean 2.2) than for CD127mid (mean 1.5) and CD127hi cells (mean 1.2) (p<0.01). (E) Proliferation index of peptide-stimulated HCV-specific CD8+ T cells in the presence (right side) and absence (left side) of PD-L1 blockade. The proliferation index (PI) was calculated by the formula (frequency of HCV-specific CD8+ T cells after culture/frequency of HCV-specific CD8+ T cells ex vivo) and reflects the proliferative capacity of the cell, which was highest for CD127hi HCV-specific CD8+ T cells compared to CD127mid and CD127lo cells.
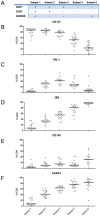
Figure 5. Receptor expression profiles are linked to T cell differentiation.
(A) Schematic overview of the differentiation stage of CD8+ T cells assessed by differential CD27, CCR7 and CD45RA expression. (B–F) Expression of CD127 and inhibitory receptors PD-1, 2B4, CD160 and KLRG1 in individual CD8+ T cell differentiation subsets. Each dot represents the frequency of CD127 or inhibitory receptor expression on CD8+ T cells belonging to the given differentiation subset of an individual patient.
Figure 6. Coexpression of 2B4, CD160 and KLRG1 with PD-1 is linked to an intermediate differentiation stage.
Frequency of CD8+ T cells coexpressing inhibitory receptors 2B4, CD160 and KLRG1 next to PD-1 is shown depending on the differentiation stage as defined in Fig. 5A. Values were calculated by dividing the number of coexpressing CD8+ T cells belonging to the 5 differentiation subsets analyzed by the total number of coexpressing CD8+ T cells. A total of 5 patients were analyzed.
Figure 7. Differences in HCV-specific CD8+ T cell differentiation depending on CD127 expression.
The frequency of HCV-specific CD8+ T cells identified in the differentiation subsets defined in Fig. 5A is depicted for CD127hi (Black circles), CD127mid (grey circles) and CD127lo (white circles) responses. Significant differences between CD127 subgroups were observed for differentiation subset 2 (p<0.0001) and subset 3 (p<0.0001). The majority of CD127hi responses was found in subset 2 (median 64,8%) while the majority of CD127lo cells was observed in subset 3 (median 68,1%). CD127mid cells were distributed at comparable levels in subset 2 (median 38,7%) and subset 3 (median 45,7%).
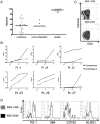
Figure 8. Inhibitory receptor expression is linked to recognition of viral antigen.
(A) CD127 expression of HCV-specific CD8+ T cells grouped depending on the autologous virus sequence. Cross-recognition was defined as sequence variation from consensus that has been previously shown to be cross-recognized . (B) PBMC of patients with variant autologous sequences (see table 2) were stimulated for IFN-γ expression after short term culture with different concentrations of consensus peptide (black line) or variant autologous peptide (dashed line). Representative diagrams are shown for pts. 4, 24–27 and 32. Frequency of IFN-γ expression is shown on the y axis, peptide concentration (µM) on the x axis. Viral escape is indicated by the strongly reduced IFN-γ production after stimulation with the autologous peptide sequence. (C) Divergent CD127 expression by HCV-specific CD8+ T cells on two epitopes from a single individual (pt. 4) targeting the NS3-1406 and NS5-2594 epitopes. (D) Overlay histograms of PD-1, 2B4, CD160 and KLRG1 expression on NS3-1406-specific CD8+ T cells (CD127hi) and NS5-2594-specific CD8+ T cells (CD127lo) from patient 4.
Figure 9. Upregulation of inhibitory receptor expression on CD127hi cells upon antigen stimulation.
Comparison of CD127, PD-1, 2B4, CD160 and KLRG1 expression on HCV-specific CD8+ T cells prior and 7 days post stimulation are shown by overlay histograms for representative patient 24 (total n = 14).
Similar articles
- Analysis of CD127 and KLRG1 expression on hepatitis C virus-specific CD8+ T cells reveals the existence of different memory T-cell subsets in the peripheral blood and liver.
Bengsch B, Spangenberg HC, Kersting N, Neumann-Haefelin C, Panther E, von Weizsäcker F, Blum HE, Pircher H, Thimme R. Bengsch B, et al. J Virol. 2007 Jan;81(2):945-53. doi: 10.1128/JVI.01354-06. Epub 2006 Nov 1. J Virol. 2007. PMID: 17079288 Free PMC article. - CD160-associated CD8 T-cell functional impairment is independent of PD-1 expression.
Viganò S, Banga R, Bellanger F, Pellaton C, Farina A, Comte D, Harari A, Perreau M. Viganò S, et al. PLoS Pathog. 2014 Sep 25;10(9):e1004380. doi: 10.1371/journal.ppat.1004380. eCollection 2014 Sep. PLoS Pathog. 2014. PMID: 25255144 Free PMC article. - Functional restoration of HCV-specific CD8 T cells by PD-1 blockade is defined by PD-1 expression and compartmentalization.
Nakamoto N, Kaplan DE, Coleclough J, Li Y, Valiga ME, Kaminski M, Shaked A, Olthoff K, Gostick E, Price DA, Freeman GJ, Wherry EJ, Chang KM. Nakamoto N, et al. Gastroenterology. 2008 Jun;134(7):1927-37, 1937.e1-2. doi: 10.1053/j.gastro.2008.02.033. Epub 2008 Feb 17. Gastroenterology. 2008. PMID: 18549878 Free PMC article. - Costimulatory molecule programmed death-1 in the cytotoxic response during chronic hepatitis C.
Larrubia JR, Benito-Martínez S, Miquel J, Calvino M, Sanz-de-Villalobos E, Parra-Cid T. Larrubia JR, et al. World J Gastroenterol. 2009 Nov 7;15(41):5129-40. doi: 10.3748/wjg.15.5129. World J Gastroenterol. 2009. PMID: 19891011 Free PMC article. Review. - Coinhibitory receptors and CD8 T cell exhaustion in chronic infections.
Kuchroo VK, Anderson AC, Petrovas C. Kuchroo VK, et al. Curr Opin HIV AIDS. 2014 Sep;9(5):439-45. doi: 10.1097/COH.0000000000000088. Curr Opin HIV AIDS. 2014. PMID: 25010894 Review.
Cited by
- PD-1+ and TIM-3+ T cells widely express common γ-chain cytokine receptors in multiple myeloma patients, and IL-2, IL-7, IL-15 stimulation up-regulates PD-1 and TIM-3 on T cells.
Batorov EV, Ineshina AD, Aristova TA, Denisova VV, Sizikova SA, Batorova DS, Ushakova GY, Shevela EY, Chernykh ER. Batorov EV, et al. Oncol Res. 2024 Sep 18;32(10):1575-1587. doi: 10.32604/or.2024.047893. eCollection 2024. Oncol Res. 2024. PMID: 39308517 Free PMC article. - Attenuated effector T cells are linked to control of chronic HBV infection.
Heim K, Sagar, Sogukpinar Ö, Llewellyn-Lacey S, Price DA, Emmerich F, Kraft ARM, Cornberg M, Kielbassa S, Knolle P, Wohlleber D, Bengsch B, Boettler T, Neumann-Haefelin C, Thimme R, Hofmann M. Heim K, et al. Nat Immunol. 2024 Sep;25(9):1650-1662. doi: 10.1038/s41590-024-01928-4. Epub 2024 Aug 28. Nat Immunol. 2024. PMID: 39198634 Free PMC article. - The role of KLRG1: a novel biomarker and new therapeutic target.
Zhang Y, Chen S, Tang X, Peng Y, Jiang T, Zhang X, Li J, Liu Y, Yang Z. Zhang Y, et al. Cell Commun Signal. 2024 Jun 19;22(1):337. doi: 10.1186/s12964-024-01714-7. Cell Commun Signal. 2024. PMID: 38898461 Free PMC article. Review. - KLRG1-expressing CD8+ T cells are exhausted and polyfunctional in patients with chronic hepatitis B.
Wang L, Liao F, Yang L, Jiang L, Duan L, Wang B, Mu D, Chen J, Huang Y, Hu Q, Chen W. Wang L, et al. PLoS One. 2024 May 22;19(5):e0303945. doi: 10.1371/journal.pone.0303945. eCollection 2024. PLoS One. 2024. PMID: 38776335 Free PMC article. - The wild mouse bone marrow has a unique myeloid and lymphoid composition and phenotype.
Muir A, Bennett A, Smith H, Logunova L, Wolfenden A, Fenn J, Lowe AE, Brass A, Grainger JR, Konkel JE, Bradley JE, Mair I, Else KJ. Muir A, et al. Discov Immunol. 2023 Apr 18;2(1):kyad005. doi: 10.1093/discim/kyad005. eCollection 2023. Discov Immunol. 2023. PMID: 38567065 Free PMC article.
References
- Barber DL, Wherry EJ, Masopust D, Zhu B, Allison JP, et al. Restoring function in exhausted CD8 T cells during chronic viral infection. Nature. 2006;439:682–687. - PubMed
- Penna A, Pilli M, Zerbini A, Orlandini A, Mezzadri S, et al. Dysfunction and functional restoration of HCV-specific CD8 responses in chronic hepatitis C virus infection. Hepatology. 2007;45:588–601. - PubMed
Publication types
MeSH terms
Substances
LinkOut - more resources
Full Text Sources
Medical
Molecular Biology Databases
Research Materials


