Locus co-occupancy, nucleosome positioning, and H3K4me1 regulate the functionality of FOXA2-, HNF4A-, and PDX1-bound loci in islets and liver - PubMed (original) (raw)
. 2010 Aug;20(8):1037-51.
doi: 10.1101/gr.104356.109. Epub 2010 Jun 15.
Gordon Robertson, Bogard Zavaglia, Mike Beach, Rebecca Cullum, Sam Lee, Galina Soukhatcheva, Leping Li, Elizabeth D Wederell, Nina Thiessen, Mikhail Bilenky, Timothee Cezard, Angela Tam, Baljit Kamoh, Inanc Birol, Derek Dai, Yongjun Zhao, Martin Hirst, C Bruce Verchere, Cheryl D Helgason, Marco A Marra, Steven J M Jones, Pamela A Hoodless
Affiliations
- PMID: 20551221
- PMCID: PMC2909568
- DOI: 10.1101/gr.104356.109
Locus co-occupancy, nucleosome positioning, and H3K4me1 regulate the functionality of FOXA2-, HNF4A-, and PDX1-bound loci in islets and liver
Brad G Hoffman et al. Genome Res. 2010 Aug.
Abstract
The liver and pancreas share a common origin and coexpress several transcription factors. To gain insight into the transcriptional networks regulating the function of these tissues, we globally identify binding sites for FOXA2 in adult mouse islets and liver, PDX1 in islets, and HNF4A in liver. Because most eukaryotic transcription factors bind thousands of loci, many of which are thought to be inactive, methods that can discriminate functionally active binding events are essential for the interpretation of genome-wide transcription factor binding data. To develop such a method, we also generated genome-wide H3K4me1 and H3K4me3 localization data in these tissues. By analyzing our binding and histone methylation data in combination with comprehensive gene expression data, we show that H3K4me1 enrichment profiles discriminate transcription factor occupied loci into three classes: those that are functionally active, those that are poised for activation, and those that reflect pioneer-like transcription factor activity. Furthermore, we demonstrate that the regulated presence of H3K4me1-marked nucleosomes at transcription factor occupied promoters and enhancers controls their activity, implicating both tissue-specific transcription factor binding and nucleosome remodeling complex recruitment in determining tissue-specific gene expression. Finally, we apply these approaches to generate novel insights into how FOXA2, PDX1, and HNF4A cooperate to drive islet- and liver-specific gene expression.
Figures
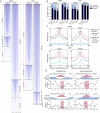
Figure 1.
H3K4me1 profiles segregate discrete classes of transcription factor occupied loci. (A) Heatmaps of H3K4me1 read density in ±2-kb regions centered on FOXA2 (islets or liver), PDX1, and HNF4A peak maxima. Peak max locations are indicated by red triangles, with flanking H3K4me1 read density plotted horizontally in blue for each site. H3K4me1 read density is represented by the intensity of blue in the heatmaps: (dark blue) high; (light blue) low read density; (white) minimal or no H3K4me1. (B) Fractions of bimodal, monomodal, or low H3K4me1 promoter, enhancer, or distal (>50 kb from any RefSeq TSS) loci in each library. (C) Mean H3K4me1 enrichment profiles associated with promoter and enhancer loci in each site class in the FOXA2 (islets or liver), PDX1, and HNF4A peak sets. Peak maxima are centered at 0. (D) Nucleosome mapping by MNase-qPCR confirms the presence of nucleosomes. (Left) Flanking selected bimodal sites; (right) immediately at or adjacent to transcription factors binding locations at monomodal sites. UCSC Genome Browser screenshots of representative PDX1 (top panel) and HNF4A (bottom panels) loci are shown, and the locations of the primers used in the MNase-qPCR are indicated. The panels beneath the browser screenshots show MNase-qPCR results, with regions of relative enrichment indicative of nucleosome positions. The red-highlighted regions indicate the primer pairs flanking identified motif locations and represent the location of transcription factor binding; the dashed lines, at a relative occupancy of 0.25, are shown as a reference.
Figure 2.
Bimodal and monomodal transcription factor occupied loci have a similar genomic distribution. (A) Distributions of distance to the closest transcriptional start site (dTSS) for transcription factor occupied loci within 50 kb of a RefSeq gene TSS. (B) Fractions of bimodal, monomodal, or low H3K4me1 sites in transcriptionally active, inactive, or non-genic regions. (C) Proportion of bimodal, monomodal, or low H3K4me1 sites associated with an expressed (tag count >5), non-expressed (H3K4me3 marks at the promoter, tag count <5), or silenced (no H3K4me3 at the promoter, tag count <5) genes.
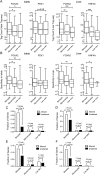
Figure 3.
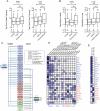
Bimodal sites regulate target gene expression. Box-whisker plots of islet or liver (A) Tag-seq counts or (B) specificity against 202 other mouse SAGE libraries, for expressed genes associated with a bimodal, monomodal, or low H3K4me1 site in the FOXA2 (islet or liver), PDX1, or HNF4A peak sets. Expressed genes have a tag count >5 in the particular Tag-seq library. Statistically significant differences were detected using a Kruskall-Wallis non-parametric test with a Dunn's multiple comparison correction, with a P < 0.05 threshold. (*) P < 0.05; (**) P < 0.01; (***) P < 0.001. Fractions of RefSeq genes with bimodal, monomodal, or low H3K4me1sites whose expression was significantly altered or not in (C) PancChip 6.1 (
) comparisons of Foxa2 deficient (Foxa2loxP/loxP, _Pdx1_-CreERT2, tamoxifen treated) versus control (Foxa2loxP/loxP, tamoxifen treated) islets (Gao et al. 2007). (D) Tag-seq analysis of islets treated with siRNA's targeting Pdx1 versus with siRNA's targeting Ppib. (E) Agilent 4×44k array comparisons of Foxa2 deficient (Foxa2loxP/loxP, _Alfp_-Cre) versus wild-type livers (Bochkis et al. 2009). (F) Agilent Whole Mouse Genome Microarray comparisons of Hnf4a deficient (_Hnf4a_loxP/loxP, _Alb_-Cre) versus wild-type livers (Holloway et al. 2008). _P_-values were determined using Fisher's exact test.
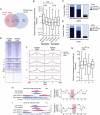
Figure 4.
Tissue-specific FOXA2 binding and nucleosome occupancy determine tissue-specific target gene expression. (A) Venn diagram representing the proportion of sites shared between the FOXA2 islet and liver peak sets. (B) Box-whisker plot of the relative expression level (islets/liver) of expressed genes with associated islet- or liver-specific FOXA2 bimodal, monomodal, or low H3K4me1 sites. The fraction of FOXA2 sites shared in islets and liver that are bimodal, monomodal, or low H3K4me1 in the (C) FOXA2 islet or (D) liver peak sets. (E) A heatmap of H3K4me1 profiles in islets and liver for shared FOXA2 sites. Sites in group I are bimodal in both tissues; group II sites are bimodal in islet and monomodal in liver; groups III and VI–IX sites have low H3K4me1 (i.e., below the profile's global FDR threshold); group IV sites are islet monomodal and liver bimodal; and group V sites are islet and liver monomodal. (F) Profiles of average H3K4me1 read density for the shared site groups. Solid red lines are the average red densities for all peaks in a category, while dotted lines represent data from the high-confidence subset. (G) Box-whisker plot of the relative expression level (islets/liver) of expressed genes associated with peaks in groups I, II, IV, and V. Nucleosome mapping by MNase-qPCR confirms that nucleosome occupancy at transcription factor loci is altered at loci that are bimodal in islets and monomodal in liver (H), and vice versa (I). (Left) ChIP-seq enrichment profiles of the assessed loci, with the locations of the primers used for MNase-qPCR. (Right) Fold changes in nucleosome enrichment in islets/liver, calculated from MNase-qPCR results. Red arrows indicate regions that were specifically enriched for nucleosomes in islets, while blue arrows indicate regions that were specifically enriched for nucleosomes in liver. The red-highlighted regions indicate the primer pairs flanking identified FOXA2 binding motif locations and represent the relative location of FOXA2 binding. In B and G differences in expression were assessed using a Kruskall-Wallace non-parametric test with a Dunn's comparison. (*) P < 0.05; (***) P < 0.001.
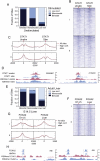
Figure 5.
H3K4me1-marked nucleosome occupancy regulates transcription factor bound _cis_-regulatory site function. Analysis of H3K4me1 transitions for transcription factor occupied loci during (A–D) an IFNG-stimulated signaling event, or (E–H) liver development. (A) STAT1 site class transitions in the IFNG-stimulated and unstimulated shared peaks, or (E) FOXA2 adult occupied loci in E14.5 hepatocytes and adult liver. Categories I and II in the heatmaps in B and F represent bimodal–monomodal and monomodal–bimodal transitions for STAT1 and FOXA2 sites, respectively. Average H3K4me1 enrichment profiles of category I or II sites are plotted in red, with dotted lines showing the average profiles for high confidence peaks. UCSC mm8 Genome Browser screenshots of representative loci that are bound by (D) STAT1 in the IFNG-stimulated and unstimulated cells that transition from bimodal to monomodal or vice versa, or (H) by FOXA2 and HNF4A in adult liver but transition from bimodal to monomodal or vice versa. The dotted lines in D and H mark 1-kb regions.
Figure 6.
Site modality is independent of motif presence or score. (A) Box-whisker plots of bimodal, monomodal, or low FOXA2, PDX1, or HNF4A peak heights. Statistical significance between groups was detected using a Kruskall-Wallis non-parametric test with a Dunn's post-test, with a P < 0.05 threshold. (***) P < 0.001. (B) Fraction of peaks in the bimodal, monomodal, or low site classes in the FOXA2 (islet and liver), PDX1, HNF4A peak sets that contain a high-scoring binding motif. (C) Frequency distribution of PWM scores for the three site classes for each TF peak set.
Figure 7.
Co-factors bind few of their available motifs at monomodal or low H3K4me1 sites. Venn diagrams showing the number of loci shared by (A) PDX1 and FOXA2 in islets or (B) FOXA2 and HNF4A in the liver. (C) Fraction of co-bound islet sites (FOXA2–PDX1) versus FOXA2 (FOXA2) only, or PDX1 (PDX1) only sites that have bimodal, monomodal, or low H3K4me1 profiles. (D) Fraction of co-bound liver sites (FOXA2–HNF4A) versus FOXA2 (FOXA2) only or HNF4A (HNF4A) only sites that have bimodal, monomodal, or low H3K4me1 profiles. (E) Fraction of bimodal, monomodal, or low H3K4me1 sites in the FOXA2 (islet and liver), PDX1, and HNF4A peak sets that contain a motif for the indicated transcription factors. (F) The fraction of sites that contain a motif for a potential TF binding partner (FOXA2 with PDX1 in islets and FOXA2 with HNF4A in liver) actually co-bound in the bimodal, monomodal, or low H3K4me1 peak sets.
Figure 8.
Co-occupancy at bimodal sites drives tissue-specific gene expression. Box-whisker plots of islet or liver (A) Tag-seq counts or (B) specificity against 202 other mouse SAGE libraries, for expressed genes associated with bimodal sites either singly occupied by FOXA2, PDX1, or HNF4A, or co-occupied by FOXA2–PDX1 in islets, or FOXA2–HNF4A in liver. Statistically significant differences were detected using a Kruskall-Wallis non-parametric test with a Dunn's multiple comparison correction, with a P < 0.05 threshold. (*) P < 0.05; (***) P < 0.001. Bimodal FOXA2, PDX1, and/or HNF4A sites are commonly associated with islet and liver critical genes. (C) A schematic representing the presence of bimodal, monomodal, and low H3K4me1 FOXA2 (blue) and PDX1 (aqua) sites in islets (left), and of FOXA2 (blue) and HNF4A (green) sites in liver (right) associated with genes critical to islets (blue ovals), islets and liver (red ovals), or liver (green ovals) specification and/or function. The presence of one or more FOXA2, PDX1, or HNF4A bimodal sites associated with a gene is indicated by a solid colored line. The presence of one or more bimodal and one or more monomodal sites associated with a gene is indicated by a dotted colored line; the presence of monomodal sites only by a solid gray line, and of low H3K4me1 sites only by a dotted gray line. (D,E) Heatmaps of the relative expression levels (tag counts) of the indicated factors essential for proper pancreas and/or liver development or function in (D) SAGE libraries derived from endoderm, developing pancreas and liver, and adult pancreas and liver tissues, or (E) in the adult islet or liver Tag-seq libraries. Darker blue shades represent higher relative expression levels. Unambiguous tags above minimum count thresholds (four of the SAGE libraries and six for the Tag-seq libraries) for Foxa1, Nkx6-1, Prox1, Tbx3, and Afp could not be identified in the SAGE libraries.
Similar articles
- Genome-wide relationship between histone H3 lysine 4 mono- and tri-methylation and transcription factor binding.
Robertson AG, Bilenky M, Tam A, Zhao Y, Zeng T, Thiessen N, Cezard T, Fejes AP, Wederell ED, Cullum R, Euskirchen G, Krzywinski M, Birol I, Snyder M, Hoodless PA, Hirst M, Marra MA, Jones SJ. Robertson AG, et al. Genome Res. 2008 Dec;18(12):1906-17. doi: 10.1101/gr.078519.108. Epub 2008 Sep 11. Genome Res. 2008. PMID: 18787082 Free PMC article. - Identification and analysis of murine pancreatic islet enhancers.
Tennant BR, Robertson AG, Kramer M, Li L, Zhang X, Beach M, Thiessen N, Chiu R, Mungall K, Whiting CJ, Sabatini PV, Kim A, Gottardo R, Marra MA, Lynn FC, Jones SJ, Hoodless PA, Hoffman BG. Tennant BR, et al. Diabetologia. 2013 Mar;56(3):542-52. doi: 10.1007/s00125-012-2797-5. Epub 2012 Dec 14. Diabetologia. 2013. PMID: 23238790 Free PMC article. - Foxa2 and Pdx1 cooperatively regulate postnatal maturation of pancreatic β-cells.
Bastidas-Ponce A, Roscioni SS, Burtscher I, Bader E, Sterr M, Bakhti M, Lickert H. Bastidas-Ponce A, et al. Mol Metab. 2017 Mar 25;6(6):524-534. doi: 10.1016/j.molmet.2017.03.007. eCollection 2017 Jun. Mol Metab. 2017. PMID: 28580283 Free PMC article. - Dynamic regulation of Pdx1 enhancers by Foxa1 and Foxa2 is essential for pancreas development.
Gao N, LeLay J, Vatamaniuk MZ, Rieck S, Friedman JR, Kaestner KH. Gao N, et al. Genes Dev. 2008 Dec 15;22(24):3435-48. doi: 10.1101/gad.1752608. Genes Dev. 2008. PMID: 19141476 Free PMC article. - Probabilistic inference for nucleosome positioning with MNase-based or sonicated short-read data.
Zhang X, Robertson G, Woo S, Hoffman BG, Gottardo R. Zhang X, et al. PLoS One. 2012;7(2):e32095. doi: 10.1371/journal.pone.0032095. Epub 2012 Feb 29. PLoS One. 2012. PMID: 22393380 Free PMC article.
Cited by
- Genome-wide analysis of chromatin states reveals distinct mechanisms of sex-dependent gene regulation in male and female mouse liver.
Sugathan A, Waxman DJ. Sugathan A, et al. Mol Cell Biol. 2013 Sep;33(18):3594-610. doi: 10.1128/MCB.00280-13. Epub 2013 Jul 8. Mol Cell Biol. 2013. PMID: 23836885 Free PMC article. - Arpeggio: harmonic compression of ChIP-seq data reveals protein-chromatin interaction signatures.
Stanton KP, Parisi F, Strino F, Rabin N, Asp P, Kluger Y. Stanton KP, et al. Nucleic Acids Res. 2013 Sep;41(16):e161. doi: 10.1093/nar/gkt627. Epub 2013 Jul 19. Nucleic Acids Res. 2013. PMID: 23873955 Free PMC article. - Epigenetic switch involved in activation of pioneer factor FOXA1-dependent enhancers.
Sérandour AA, Avner S, Percevault F, Demay F, Bizot M, Lucchetti-Miganeh C, Barloy-Hubler F, Brown M, Lupien M, Métivier R, Salbert G, Eeckhoute J. Sérandour AA, et al. Genome Res. 2011 Apr;21(4):555-65. doi: 10.1101/gr.111534.110. Epub 2011 Jan 13. Genome Res. 2011. PMID: 21233399 Free PMC article. - Pioneer transcription factors: establishing competence for gene expression.
Zaret KS, Carroll JS. Zaret KS, et al. Genes Dev. 2011 Nov 1;25(21):2227-41. doi: 10.1101/gad.176826.111. Genes Dev. 2011. PMID: 22056668 Free PMC article. Review. - Expanded methyl-sensitive cut counting reveals hypomethylation as an epigenetic state that highlights functional sequences of the genome.
Colaneri A, Staffa N, Fargo DC, Gao Y, Wang T, Peddada SD, Birnbaumer L. Colaneri A, et al. Proc Natl Acad Sci U S A. 2011 Jun 7;108(23):9715-20. doi: 10.1073/pnas.1105713108. Epub 2011 May 20. Proc Natl Acad Sci U S A. 2011. PMID: 21602498 Free PMC article.
References
- Adeghate E, Parvez SH 2000. Nitric oxide and neuronal and pancreatic beta cell death. Toxicology 153: 143–156 - PubMed
- Albert I, Mavrich TN, Tomsho LP, Qi J, Zanton SJ, Schuster SC, Pugh BF 2007. Translational and rotational settings of H2A.Z nucleosomes across the Saccharomyces cerevisiae genome. Nature 446: 572–576 - PubMed
Publication types
MeSH terms
Substances
LinkOut - more resources
Full Text Sources
Other Literature Sources
Molecular Biology Databases
