Interferon-gamma produced by microglia and the neuropeptide PACAP have opposite effects on the viability of neural progenitor cells - PubMed (original) (raw)
Interferon-gamma produced by microglia and the neuropeptide PACAP have opposite effects on the viability of neural progenitor cells
Johanna Mäkelä et al. PLoS One. 2010.
Abstract
Inflammation is part of many neurological disorders and immune reactions may influence neuronal progenitor cells (NPCs) contributing to the disease process. Our knowledge about the interplay between different cell types in brain inflammation are not fully understood. It is important to know the mechanisms and factors involved in order to enhance regeneration and brain repair. We show here that NPCs express receptors for interferon-gamma (IFNgamma), and IFNgamma activates the signal transducer and activator of transcription (STAT) protein-1. IFNgamma reduced cell proliferation in NPCs by upregulation of the cell cycle protein p21 as well as induced cell death of NPCs by activating caspase-3. Studies of putative factors for rescue showed that the neuropeptide, Pituitary adenylate cyclase-activating polypeptide (PACAP) increased cell viability, the levels of p-Bad and reduced caspase-3 activation in the NPCs. Medium from cultured microglia contained IFNgamma and decreased the viability of NPCs, whilst blocking with anti-IFNgamma antibodies counteracted this effect. The results show that NPCs are negatively influenced by IFNgamma whereas PACAP is able to modulate its action. The interplay between IFNgamma released from immune cells and PACAP is of importance in brain inflammation and may affect the regeneration and recruitment of NPCs in immune diseases. The observed effects of IFNgamma on NPCs deserve to be taken into account in human anti-viral therapies particularly in children with higher rates of brain stem cell proliferation.
Conflict of interest statement
Competing Interests: The authors have declared that no competing interests exist.
Figures
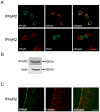
Figure 1. Neural progenitor cells express IFNγ receptors.
NPCs were prepared from embryonic, E17 old rat brain and cultured as described in Methods. (A) Upper panel. Immunostaining using antibodies against the IFNγR2 receptor (green fluorescence) and against nestin (red fluorescence) as a marker for NPCs. Control without primary antibody showed no staining. Lower panel. BrdU labeling was done as described in Methods. Note expression of IFNγR2 in dividing NPCs. Scale bar, 10 µm. (B) Immunoblot shows the presence of IFNγR2. β-actin was used as control. (C) Sections from E17 rats were double-stained using antibodies against nestin and IFNγR2. Note coexpression in cells in neuroepithelium. Scale bar, 90 µm.
Figure 2. IFNγ activates STAT signaling and decreases cell viability of NPCs.
NPCs were treated with 100 ng/ml IFNγ for different times and analyzed as described in Methods. *p<0.05 and **p<0.001 comparing IFNγ treated vs. controls. (A) Immunoblot shows increased levels of phospho-STAT1 (p-Stat1) after 0.5 h. (B) Immunostaining showed the presence of p-Stat1 in the nucleus after 2 h treatment. Scale bar, 10 µm. (C) Cell viability was determined by the MTT assay as described in Methods. Values are means ±SD, n = 4. (D) Dose response curve. Cells were treated for 48 h and cell viability determined. Values are means ±SD, n = 4. (E) Cells were treated for 48 h and the number of nestin positive NPCs was analyzed. Values are means ±SD, n = 4. (F) Neurospheres were dissociated and about 5000 cells per well were incubated for 3days in absence or presence of 100 ng/ml IFNγ. The number of secondary neurospheres formed was counted. Values are means ±SD, n = 4.
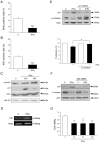
Figure 3. IFNγ decreases cell proliferation of NPCs via p21.
NPCs were treated with 100 ng/ml IFNγ for 2 days. *p<0.05 and ***p<0.001 comparing IFNγ treated vs. controls. (A) 10 µM BrdU was added to the cultures to label DNA and immunostaining done using anti-BrdU antibodies. Values are means±SD, n = 4. (B) Immunostaining using antibody against Ki67. Values are means±SD, n = 4. (C) Immunoblots. Cells were treated for 24 h. Note upregulation of p21 with no change in cyclinD1. Immunoprecipitation (IP) of p53 was performed prior to blotting. (D) RT-PCR for p21 was done as described. Typical experiment is shown and was repeated 3 times. (E) NPCs were treated with siRNA against p21 for 2 days followed by IFNγ for 24 h Upper panel, Immunoblots showing p-vimentin as a measure of cell proliferation. IFNγ decreased p-vimentin in control but not in p21-siRNA treated cells. Lower panel, BrdU labeling was decreased in control but not in p21-siRNA treated cells. (F) NPCs were treated with siRNA against p53 followed by IFNγ as above. IFNγ reduces cell proliferation in p53-siRNA treated cells. (G) p53 gene deleted mouse embryonic fibroblasts were treated with 10–100 ng/ml IFNγ for 2 days and cell viability determined as described in Methods.
Figure 4. IFNγ induces cell death in NPCs via caspase-3.
NPCs were treated with 100 ng/ml IFNγ for different time periods and analyzed further. *p<0.05 and **p<0.01 comparing IFNγ treated vs. controls. (A) Number of propidium iodine positive cells was determined by counting. Values are means±SD, n = 4. (B) Number of TUNEL positive cells. Values are means +SD, n = 3. Inset show typical labeling in control and IFNγ treated cells. (C) Immunoblot. Note increased active caspase-3 (17 kDa band) and cleaved PARP (89 kDa). Typical blot is shown and was repeated three times. (D) Effect of caspase inhibitor. NPCs were incubated for 24 h with 50 µM BAF in conjunction with IFNγ. Values are means +SD, n = 3.
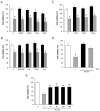
Figure 5. Effects of different factors in IFNγ-treated NPCs.
NPCs were untreated (white bars) or treated for 24 h with various factors alone (black bars) or together with 100 ng/ml IFNγ (grey bars). Cell viability was assayed by MTT. Values are means±SD, n = 4. *p<0.05 for IFNγ treated vs. controls. (A) BDNF and GDNF were used at 50 ng/ml and IFNs at 100 ng/ml. Values are means±SD, n = 4. No increase in viability by the factors. (B) Different cytokines were used at 50 ng/ml. No increase in viability by the factors. (C) 100 ng/ml Indometacin (Indo), 100 ng/ml Minocyclin (Mino), and 1 µM Forskolin (Forsk) were used. No increase in viability by the compounds. (D) 100 ng/ml PACAP increased cell viability reduced by IFNγ. (E) Dose response curve for PACAP. **P<0.01 for PACAP+IFNγ vs. IFNγ.
Figure 6. Effect of PACAP on NPCs.
NPCs were treated for 24 h with 100 ng/ml IFNγ alone or in conjunction with 100 ng/ml PACAP. (A) Immunoblot. Cells were treated for 2 h. PACAP did not influence levels of p-Stat1 induced by IFNγ. (B) RT-PCR. SOCS-1 and –3 levels are not influenced by PACAP. IFNγ upregulated SOCS1. (C) Immunoblots. IFNγ increased whilst PACAP decreased levels of PUMA. PACAP also decreased active caspase-3 (17 kDa band). Typical blot is shown and was repeated three times. (D) Immunoblots. PACAP increased levels of p-Bad. Typical blot is shown and was repeated three times. (E) Effects of the kinase inhibitors on cell viability measured by MTT. 1 µM Gö6976 reduced the beneficial effect of PACAP whereas 10 µM H89 had no effect. Values are means ±SD, n = 4. *** p<0.005 for IFNγ vs. controls, and *p<0.0 for IFNγ+PACAP vs. IFNγ, and for GÖ+ IFNγ+PACAP vs. IFNγ+PACAP. (F) BrdU labeling. PACAP increases cell proliferation significantly in control but not in IFNγ treated cells. Values are means±SD, n = 4. * p<0.05 for PACAP vs control cells, n = 3.
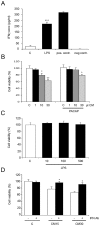
Figure 7. Microglia-conditioned medium decreases NPC viability.
Microglial cells from rat brain were cultured and treated as described in Methods. (A) Activation of microglia using 500 ng/ml LPS. IFNγ was studied using ELISA as described in Methods. Positive and negative controls were from the Quantikine kit. ***p<0.001 vs. controls, n = 4. (B) Left panels, 30 µl medium from control microglia (C) or 1–30 µl conditioned-medium (CM) from LPS-treated microglia was added to 100 µl NPCs cultures. Values are means ±SD n = 3. *p<0.02 and **p<0.05 for 10–30 µl CM vs. C Right panels, 50 ng/ml PACAP was added to half the cultures and cell viability assayed after 24 h using MTT. *p<0.05 for 30 µl PACAP+CM vs. C. (C) 10–500 ng/ml LPS was added directly to NPCs for 24 and cell viability studied. No change with LPS alone. (D) NPCs were incubated with 30 µl control medium (C) or with 15 (CM15) or 30 µl (CM30) medium from LPS-treated microglia in absence or presence of 0.25 µg/ml blocking anti-IFNγ antibodies (IFN-Ab). Values are means ±SD n = 3. *p<0.02 for IFN-Ab vs. CM-treated cultures.
Similar articles
- PACAP/PAC1 autocrine system promotes proliferation and astrogenesis in neural progenitor cells.
Nishimoto M, Furuta A, Aoki S, Kudo Y, Miyakawa H, Wada K. Nishimoto M, et al. Glia. 2007 Feb;55(3):317-27. doi: 10.1002/glia.20461. Glia. 2007. PMID: 17115416 - Human mesenchymal stem/stromal cells suppress spinal inflammation in mice with contribution of pituitary adenylate cyclase-activating polypeptide (PACAP).
Tsumuraya T, Ohtaki H, Song D, Sato A, Watanabe J, Hiraizumi Y, Nakamachi T, Xu Z, Dohi K, Hashimoto H, Atsumi T, Shioda S. Tsumuraya T, et al. J Neuroinflammation. 2015 Feb 22;12:35. doi: 10.1186/s12974-015-0252-5. J Neuroinflammation. 2015. PMID: 25889720 Free PMC article. - Role of PACAP in neural stem/progenitor cell and astrocyte--from neural development to neural repair.
Nakamachi T, Farkas J, Watanabe J, Ohtaki H, Dohi K, Arata S, Shioda S. Nakamachi T, et al. Curr Pharm Des. 2011;17(10):973-84. doi: 10.2174/138161211795589346. Curr Pharm Des. 2011. PMID: 21524256 Review. - Localization, characterization and function of pituitary adenylate cyclase-activating polypeptide during brain development.
Watanabe J, Nakamachi T, Matsuno R, Hayashi D, Nakamura M, Kikuyama S, Nakajo S, Shioda S. Watanabe J, et al. Peptides. 2007 Sep;28(9):1713-9. doi: 10.1016/j.peptides.2007.06.029. Epub 2007 Jul 14. Peptides. 2007. PMID: 17719696 Review.
Cited by
- Species-dependent differences of embryonic stem cell-derived neural stem cells after Interferon gamma treatment.
Walter J, Dihné M. Walter J, et al. Front Cell Neurosci. 2012 Nov 8;6:52. doi: 10.3389/fncel.2012.00052. eCollection 2012. Front Cell Neurosci. 2012. PMID: 23162429 Free PMC article. - Stat1 is an inducible transcriptional repressor of neural stem cells self-renewal program during neuroinflammation.
Imitola J, Hollingsworth EW, Watanabe F, Olah M, Elyaman W, Starossom S, Kivisäkk P, Khoury SJ. Imitola J, et al. Front Cell Neurosci. 2023 Aug 16;17:1156802. doi: 10.3389/fncel.2023.1156802. eCollection 2023. Front Cell Neurosci. 2023. PMID: 37663126 Free PMC article. - HIV-1 and Compromised Adult Neurogenesis: Emerging Evidence for a New Paradigm of HAND Persistence.
Putatunda R, Ho WZ, Hu W. Putatunda R, et al. AIDS Rev. 2019;21(1):11-22. doi: 10.24875/AIDSRev.19000003. AIDS Rev. 2019. PMID: 30899112 Free PMC article. Review. - Distinct plasma immune signatures in ME/CFS are present early in the course of illness.
Hornig M, Montoya JG, Klimas NG, Levine S, Felsenstein D, Bateman L, Peterson DL, Gottschalk CG, Schultz AF, Che X, Eddy ML, Komaroff AL, Lipkin WI. Hornig M, et al. Sci Adv. 2015 Feb;1(1):e1400121. doi: 10.1126/sciadv.1400121. Sci Adv. 2015. PMID: 26079000 Free PMC article. - Cutting Edge: IFN-γ Produced by Brain-Resident Cells Is Crucial To Control Cerebral Infection with Toxoplasma gondii.
Sa Q, Ochiai E, Tiwari A, Perkins S, Mullins J, Gehman M, Huckle W, Eyestone WH, Saunders TL, Shelton BJ, Suzuki Y. Sa Q, et al. J Immunol. 2015 Aug 1;195(3):796-800. doi: 10.4049/jimmunol.1500814. Epub 2015 Jun 19. J Immunol. 2015. PMID: 26091720 Free PMC article.
References
- Wyss-Coray T, Mucke L. Inflammation in neurodegenerative disease–a double-edged sword. Neuron. 2002;35:419–432. - PubMed
- Monje ML, Toda H, Palmer TD. Inflammatory blockade restores adult hippocampal neurogenesis. Science. 2003;302:1760–1765. - PubMed
- Marín-Teva JL, Dusart I, Colin C, Gervais A, van Rooijen N, et al. Microglia promote the death of developing Purkinje cells. Neuron. 2004;41:535–547. - PubMed
- McKay R. Stem cells in the central nervous system. Science. 1997;276:66–71. - PubMed
- Gage FH. Mammalian neural stem cells. Science. 2000;287:1433–1438. - PubMed
Publication types
MeSH terms
Substances
LinkOut - more resources
Full Text Sources
Medical
Research Materials


