Savant: genome browser for high-throughput sequencing data - PubMed (original) (raw)
Savant: genome browser for high-throughput sequencing data
Marc Fiume et al. Bioinformatics. 2010.
Abstract
Motivation: The advent of high-throughput sequencing (HTS) technologies has made it affordable to sequence many individuals' genomes. Simultaneously the computational analysis of the large volumes of data generated by the new sequencing machines remains a challenge. While a plethora of tools are available to map the resulting reads to a reference genome, and to conduct primary analysis of the mappings, it is often necessary to visually examine the results and underlying data to confirm predictions and understand the functional effects, especially in the context of other datasets.
Results: We introduce Savant, the Sequence Annotation, Visualization and ANalysis Tool, a desktop visualization and analysis browser for genomic data. Savant was developed for visualizing and analyzing HTS data, with special care taken to enable dynamic visualization in the presence of gigabases of genomic reads and references the size of the human genome. Savant supports the visualization of genome-based sequence, point, interval and continuous datasets, and multiple visualization modes that enable easy identification of genomic variants (including single nucleotide polymorphisms, structural and copy number variants), and functional genomic information (e.g. peaks in ChIP-seq data) in the context of genomic annotations.
Availability: Savant is freely available at http://compbio.cs.toronto.edu/savant.
Figures
Fig. 1.
Screenshot of Savant. (A) Range controls. Selection, zoom and pan controls for coarse navigation; text fields for fine navigation. Zooming and panning are also possible via keyboard and mouse commands. (B) Tracks. These represent the data in current range. Top: read alignments, with colored pixels representing differences between the reads and the reference. Bottom: color representation of the genome sequence. (C) Table View module, detached from the main interface. The table view module is displaying the mapped reads with SAM format fields. (D) Bookmarks module.
Fig. 2.
Read alignments, visualized at various resolutions and using two modes. (A) Chromosome-wide view of read mappings, showing the overall coverage (with no coverage in the centromere). (B) Regional view, still visualized as a coverage map, showing higher coverage in certain regions of the genome. (C) Local view, the reads are shown separately and differences between the reads and the reference genome are colored. Reads on the forward and reverse strand are shown with different shades of blue. (D) Matepair (arc) mode, showing the relative distance between the two reads of a pair. Taller arcs indicate larger distances between the pairs.
Fig. 3.
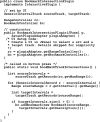
Code used to make Bookmark Intersection Plug-in. The details of the UI that allows the user to select two tracks have been omitted. Once the two tracks are selected, the bookMarkTrackIntersections() method is run, which, for each interval of one track, finds overlapping intervals of the other, and saves intervals with overlap to the bookmark panel.
Fig. 4.
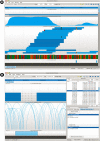
(A) Visualization of two SNP variants. The displayed tracks are, top to bottom, Conservation, Gene Models, Read Alignments, the Genome sequence and known SNPs from dbSNP. Two potential SNP variants are indicated by consistent mismatching colors within a column, with the downstream SNP previously known, while the upstream one, a heterozygous variant, not in dbSNP. (B) Identification and visualization of MoDIL indel variants that overlap exons via the plug-in framework. The visualized tracks are Gene Models, read mappings (visualized in the matepair mode) and MoDIL predictions. The panel on top right is the Bookmark module, while on the bottom right is the BookMarkIntersection plug-in described in Figure 3. To identify variants of interest, the user selects the two tracks in the BookMarkIntersection window, and those variants that overlap exons are added to the list of bookmarks. The user can then easily go through this list. In this particular case the indel likely occurs in the intron between the exons, but because of MoDIL's inability to accurately identify borders of variants, the variant is shown as overlapping.
Similar articles
- Savant Genome Browser 2: visualization and analysis for population-scale genomics.
Fiume M, Smith EJ, Brook A, Strbenac D, Turner B, Mezlini AM, Robinson MD, Wodak SJ, Brudno M. Fiume M, et al. Nucleic Acids Res. 2012 Jul;40(Web Server issue):W615-21. doi: 10.1093/nar/gks427. Epub 2012 May 25. Nucleic Acids Res. 2012. PMID: 22638571 Free PMC article. - Integrated genome browser: visual analytics platform for genomics.
Freese NH, Norris DC, Loraine AE. Freese NH, et al. Bioinformatics. 2016 Jul 15;32(14):2089-95. doi: 10.1093/bioinformatics/btw069. Epub 2016 Mar 16. Bioinformatics. 2016. PMID: 27153568 Free PMC article. - Accurate estimation of short read mapping quality for next-generation genome sequencing.
Ruffalo M, Koyutürk M, Ray S, LaFramboise T. Ruffalo M, et al. Bioinformatics. 2012 Sep 15;28(18):i349-i355. doi: 10.1093/bioinformatics/bts408. Bioinformatics. 2012. PMID: 22962451 Free PMC article. - Visualizing multidimensional cancer genomics data.
Schroeder MP, Gonzalez-Perez A, Lopez-Bigas N. Schroeder MP, et al. Genome Med. 2013 Jan 31;5(1):9. doi: 10.1186/gm413. eCollection 2013. Genome Med. 2013. PMID: 23363777 Free PMC article. Review. - Software tools for visualizing Hi-C data.
Yardımcı GG, Noble WS. Yardımcı GG, et al. Genome Biol. 2017 Feb 3;18(1):26. doi: 10.1186/s13059-017-1161-y. Genome Biol. 2017. PMID: 28159004 Free PMC article. Review.
Cited by
- Integrative Genomics Viewer (IGV): high-performance genomics data visualization and exploration.
Thorvaldsdóttir H, Robinson JT, Mesirov JP. Thorvaldsdóttir H, et al. Brief Bioinform. 2013 Mar;14(2):178-92. doi: 10.1093/bib/bbs017. Epub 2012 Apr 19. Brief Bioinform. 2013. PMID: 22517427 Free PMC article. - Bioinformatics of Cancer ncRNA in High Throughput Sequencing: Present State and Challenges.
Jorge NA, Ferreira CG, Passetti F. Jorge NA, et al. Front Genet. 2012 Dec 17;3:287. doi: 10.3389/fgene.2012.00287. eCollection 2012. Front Genet. 2012. PMID: 23251139 Free PMC article. - JEnsembl: a version-aware Java API to Ensembl data systems.
Paterson T, Law A. Paterson T, et al. Bioinformatics. 2012 Nov 1;28(21):2724-31. doi: 10.1093/bioinformatics/bts525. Epub 2012 Sep 3. Bioinformatics. 2012. PMID: 22945789 Free PMC article. - Intrinsic multiplication rate variation and plasticity of human blood stage malaria parasites.
Stewart LB, Diaz-Ingelmo O, Claessens A, Abugri J, Pearson RD, Goncalves S, Drury E, Kwiatkowski DP, Awandare GA, Conway DJ. Stewart LB, et al. Commun Biol. 2020 Oct 28;3(1):624. doi: 10.1038/s42003-020-01349-7. Commun Biol. 2020. PMID: 33116247 Free PMC article. - Trends in IT Innovation to Build a Next Generation Bioinformatics Solution to Manage and Analyse Biological Big Data Produced by NGS Technologies.
de Brevern AG, Meyniel JP, Fairhead C, Neuvéglise C, Malpertuy A. de Brevern AG, et al. Biomed Res Int. 2015;2015:904541. doi: 10.1155/2015/904541. Epub 2015 Jun 1. Biomed Res Int. 2015. PMID: 26125026 Free PMC article. Review.
References
- Dalca AV, Brudno M. Genome variation discovery with high-throughput sequencing data. Brief. Bioinform. 2010;11:3–14. - PubMed
- Gordon D, et al. Consed: a graphical tool for sequence finishing. Genome Res. 1998;8:195–202. - PubMed
Publication types
MeSH terms
LinkOut - more resources
Full Text Sources
Other Literature Sources


