Hepatic FoxO1 ablation exacerbates lipid abnormalities during hyperglycemia - PubMed (original) (raw)
Hepatic FoxO1 ablation exacerbates lipid abnormalities during hyperglycemia
Rebecca A Haeusler et al. J Biol Chem. 2010.
Abstract
Patients with diabetes suffer disproportionately from impaired lipid metabolism and cardiovascular disease, but the relevant roles of insulin resistance and hyperglycemia in these processes are unclear. Transcription factor FoxO1 is regulated dually by insulin and nutrients. In this study, we addressed the hypothesis that, in addition to its established role to regulate hepatic glucose production, FoxO1 controls aspects of lipid metabolism in the diabetic liver. Mice with a liver-specific deletion of FoxO1 (L-FoxO1) and their control littermates were rendered hyperglycemic by streptozotocin administration. Subsequently, we monitored serum lipids, liver VLDL secretion, and hepatic expression of genes related to lipid metabolism. Hepatic FoxO1 ablation resulted in increased VLDL secretion, increased cholesterol, and increased plasma free fatty acids, three hallmarks of the diabetic state. l-FoxO1 mice expressed increased levels of SREBP-2 and FGF21 without affecting lipogenic genes. We propose that FoxO1 fine tunes lipolysis through its actions on FGF21 and that hepatic FoxO1 ablation increases availability of substrates for hepatic triglyceride and cholesterol synthesis and VLDL secretion. The implications of these findings are that FoxO1 protects against excessive hepatic lipid production during hyperglycemia and that its inhibition by intensive insulin treatment may exacerbate paradoxically the lipid abnormalities of diabetes.
Figures
FIGURE 1.
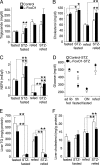
Metabolic characteristics of fasting and refeeding in untreated and STZ-treated mice. A–C, serum TG, cholesterol, and NEFA in untreated or STZ-treated mice, fasted overnight (n = 16–44) or fasted overnight then refed for 4 h (n = 5–10). D, blood glucose levels 1 week after STZ injection (n = 5–57 per group). E–F, hepatic TG and cholesterol in untreated or STZ-treated mice, fasted overnight or fasted overnight then refed for 4 h (n = 5–7). For blood glucose, *, p < 0.05 by two-tailed Student's t test. For all other analyses, *, p < 0.05 and **, p < 0.01 by two-way analysis of variance.
FIGURE 2.
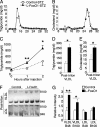
Serum lipoprotein analysis. A–B, shown are TG and cholesterol in FPLC-separated lipoprotein fractions from 5-h fasted STZ-treated control and
l
-FoxO1 mice. Sera were pooled from three mice per genotype. C, shown is the serum TG accumulation after Triton WR 1339 injection (n = 6–9 per group). Shown are TG (D) and cholesterol (E) from the VLDL fraction 2 h after Triton injection. F, VLDL and LDL ApoB proteins were analyzed by SDS-PAGE followed by Coomassie blue staining (n = 6 per group). G, shown is the quantitation of ApoB48 and ApoB100 (n = 6 per group). *, p < 0.05 and **, p < 0.01 by two-tailed Student's t test.
FIGURE 3.
LDL receptor protein visualized by Western blot in STZ-treated control and l-FoxO1 mice that were fasted overnight and subsequently refed for 4 h.
FIGURE 4.
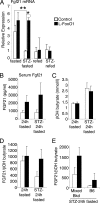
FGF21 expression. A, FGF21 mRNA from livers of untreated or STZ-treated mice, fasted overnight or fasted overnight then refed for 4 h (n = 5–9 per group). For comparison, quantitative PCR analyses were combined from three separate 96-well plates: untreated fasted versus untreated refed; untreated fasted versus STZ-treated fasted; and STZ-treated fasted versus STZ-treated refed. Each sample was measured in triplicate. B, serum FGF21 levels after a 24 h fast in untreated or STZ treated mice (n = 6–12). C, serum β-hydroxybutyrate (n = 9–13). D, the ratio of serum FGF21 to β-hydroxybutyrate was calculated for individual mice; the mean of these ratios is presented (n = 6–12). E, ratio of serum FGF21 to β-hydroxybutyrate in STZ-treated mice, separated by strain background. Mixed background line is ∼80% B6 and 15% 129, with minor contributions from FVB and DBA. The B6 line is ∼97% B6. Ratios were calculated for individual mice; the mean of these ratios is presented (n = 4–7). *, p < 0.05 and **, p < 0.01 by two-way analysis of variance.
Similar articles
- FoxO1 mediates insulin-dependent regulation of hepatic VLDL production in mice.
Kamagate A, Qu S, Perdomo G, Su D, Kim DH, Slusher S, Meseck M, Dong HH. Kamagate A, et al. J Clin Invest. 2008 Jun;118(6):2347-64. doi: 10.1172/JCI32914. J Clin Invest. 2008. PMID: 18497885 Free PMC article. - Identification of Akt-independent regulation of hepatic lipogenesis by mammalian target of rapamycin (mTOR) complex 2.
Yuan M, Pino E, Wu L, Kacergis M, Soukas AA. Yuan M, et al. J Biol Chem. 2012 Aug 24;287(35):29579-88. doi: 10.1074/jbc.M112.386854. Epub 2012 Jul 7. J Biol Chem. 2012. PMID: 22773877 Free PMC article. - Impaired-inactivation of FoxO1 contributes to glucose-mediated increases in serum very low-density lipoprotein.
Wu K, Cappel D, Martinez M, Stafford JM. Wu K, et al. Endocrinology. 2010 Aug;151(8):3566-76. doi: 10.1210/en.2010-0204. Epub 2010 May 25. Endocrinology. 2010. PMID: 20501667 Free PMC article. - FoxO1 integrates insulin signaling to VLDL production.
Kamagate A, Dong HH. Kamagate A, et al. Cell Cycle. 2008 Oct;7(20):3162-70. doi: 10.4161/cc.7.20.6882. Epub 2008 Oct 27. Cell Cycle. 2008. PMID: 18927507 Free PMC article. Review. - Triglycerides and gallstone formation.
Smelt AH. Smelt AH. Clin Chim Acta. 2010 Nov 11;411(21-22):1625-31. doi: 10.1016/j.cca.2010.08.003. Epub 2010 Aug 10. Clin Chim Acta. 2010. PMID: 20699090 Review.
Cited by
- Decreased expression of hepatic glucokinase in type 2 diabetes.
Haeusler RA, Camastra S, Astiarraga B, Nannipieri M, Anselmino M, Ferrannini E. Haeusler RA, et al. Mol Metab. 2014 Dec 18;4(3):222-6. doi: 10.1016/j.molmet.2014.12.007. eCollection 2015 Mar. Mol Metab. 2014. PMID: 25737948 Free PMC article. - Insulin sensitization by hepatic FoxO deletion is insufficient to lower atherosclerosis in mice.
Izquierdo MC, Harris M, Shanmugarajah N, Zhong K, Ozcan L, Fredman G, Haeusler RA. Izquierdo MC, et al. bioRxiv [Preprint]. 2023 Oct 18:2023.10.14.562366. doi: 10.1101/2023.10.14.562366. bioRxiv. 2023. PMID: 37905094 Free PMC article. Preprint. - Estrogens increase expression of bone morphogenetic protein 8b in brown adipose tissue of mice.
Grefhorst A, van den Beukel JC, van Houten EL, Steenbergen J, Visser JA, Themmen AP. Grefhorst A, et al. Biol Sex Differ. 2015 Apr 3;6:7. doi: 10.1186/s13293-015-0025-y. eCollection 2015. Biol Sex Differ. 2015. PMID: 25866617 Free PMC article. - Postprandial hepatic lipid metabolism requires signaling through Akt2 independent of the transcription factors FoxA2, FoxO1, and SREBP1c.
Wan M, Leavens KF, Saleh D, Easton RM, Guertin DA, Peterson TR, Kaestner KH, Sabatini DM, Birnbaum MJ. Wan M, et al. Cell Metab. 2011 Oct 5;14(4):516-27. doi: 10.1016/j.cmet.2011.09.001. Cell Metab. 2011. PMID: 21982711 Free PMC article. - Insulin regulates retinol dehydrogenase expression and all-trans-retinoic acid biosynthesis through FoxO1.
Obrochta KM, Krois CR, Campos B, Napoli JL. Obrochta KM, et al. J Biol Chem. 2015 Mar 13;290(11):7259-68. doi: 10.1074/jbc.M114.609313. Epub 2015 Jan 27. J Biol Chem. 2015. PMID: 25627686 Free PMC article.
References
- Sobel B. E. (2007) Am. J. Med. 120, S3–11 - PubMed
- Lewis G. F., Steiner G. (1996) Diabetes Care 19, 390–393 - PubMed
Publication types
MeSH terms
Substances
Grants and funding
- T32 DK007328/DK/NIDDK NIH HHS/United States
- T32DK07328/DK/NIDDK NIH HHS/United States
- P01 HL087123/HL/NHLBI NIH HHS/United States
- P30 DK063608/DK/NIDDK NIH HHS/United States
- P01HL87123/HL/NHLBI NIH HHS/United States
- P30DK63608/DK/NIDDK NIH HHS/United States
LinkOut - more resources
Full Text Sources
Medical
Research Materials
Miscellaneous


