Nix is critical to two distinct phases of mitophagy, reactive oxygen species-mediated autophagy induction and Parkin-ubiquitin-p62-mediated mitochondrial priming - PubMed (original) (raw)
Nix is critical to two distinct phases of mitophagy, reactive oxygen species-mediated autophagy induction and Parkin-ubiquitin-p62-mediated mitochondrial priming
Wen-Xing Ding et al. J Biol Chem. 2010.
Abstract
Damaged mitochondria can be eliminated by autophagy, i.e. mitophagy, which is important for cellular homeostasis and cell survival. Despite the fact that a number of factors have been found to be important for mitophagy in mammalian cells, their individual roles in the process had not been clearly defined. Parkin is a ubiquitin-protein isopeptide ligase able to translocate to the mitochondria that are to be removed. We showed here in a chemical hypoxia model of mitophagy induced by an uncoupler, carbonyl cyanide m-chlorophenylhydrazone (CCCP) that Parkin translocation resulted in mitochondrial ubiquitination and p62 recruitment to the mitochondria. Small inhibitory RNA-mediated knockdown of p62 significantly diminished mitochondrial recognition by the autophagy machinery and the subsequent elimination. Thus Parkin, ubiquitin, and p62 function in preparing mitochondria for mitophagy, here referred to as mitochondrial priming. However, these molecules were not required for the induction of autophagy machinery. Neither Parkin nor p62 seemed to affect autophagy induction by CCCP. Instead, we found that Nix was required for the autophagy induction. Nix promoted CCCP-induced mitochondrial depolarization and reactive oxygen species generation, which inhibited mTOR signaling and activated autophagy. Nix also contributed to mitochondrial priming by controlling the mitochondrial translocation of Parkin, although reactive oxygen species generation was not involved in this step. Deletion of the C-terminal membrane targeting sequence but not mutations in the BH3 domain disabled Nix for these functions. Our work thus distinguished the molecular events responsible for the different phases of mitophagy and placed Nix upstream of the events.
Figures
FIGURE 1.
CCCP induces autophagy and mitophagy. A–C, HeLa cells stably expressing GFP-LC3 (GFP-LC3-HeLa) were treated with CCCP at 20 μm (A) or at the indicated doses (B and C) in the presence or absence of CQ (10 μ
m
) for 16 h or with rapamycin (1 μ
m
) for 6 h, followed by confocal microscopy (A). Bar, 20 μm. The number of GFP-LC3/cell was quantified (B), and total lysates were subjected to Western blot analysis with anti-GFP and anti-LC3 (C). D, HCT116 cells were treated with control (panels a and b) or CCCP (20 μ
m
, panels c–e) for 16 h and examined by electron microcopy. Panel b was enlarged from the boxed area in panel a; panels d and e were enlarged from the boxed areas in panel c. E, the number of autophagosomes was counted from more than 12 different cell sections. F and G, wild type (WT), Atg5-deficient, and Atg7-deficient MEF were infected with Ad-GFP-LC3 overnight and then treated with vehicle control or CCCP (30 μ
m
) for 6 h before being analyzed for the number of GFP-LC3 puncta (F) and LC3-II formation (G). H and I, GFP-LC3 HeLa cells were treated with CCCP (30 μm) in the absence or presence of CQ (10 μ
m
) for 16 h. The number of GFP-LC3 dots/cell was quantified (H), and the total lysates were subjected to Western blot analysis with anti-LC3 (I). For B, F, and H, the data shown are the means ± S.D. #, p < 0.05; *, p < 0.01, one-way ANOVA.
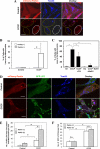
FIGURE 2.
Parkin promotes mitophagy but not autophagy induction. A, HeLa cells were transfected with mCherry-Parkin for 24 h and then treated with CCCP (30 μ
m
) for 6 h. The cells were fixed and stained with anti-Tom20, followed by confocal microscopy. The cells marked with the yellow dotted ovals expressed no or low levels of Parkin and still had mitochondria, whereas cells marked with white solid ovals expressed a high level of Parkin and had no mitochondria. Bars, 20 μm. B, the percentage of cells with less or no mitochondria were quantified in Parkin-positive and -negative cells. *, p < 0.01, Z test. C, HEK 293-mCherry-Parkin cells were treated as indicated with CQ (10 μ
m
) or bafilomycin A1 (BafA1, 100 n
m
). The percentages of cells with less or no mitochondria were quantified in Parkin-positive cells. *, p < 0.05, Z-test. Ctl, control. D, GFP-LC3-HeLa cells were transfected with mCherry-Parkin (red) for 24 h and then treated with CCCP (30 μ
m
) for 6 h. The cells were fixed and immunostained for Tom20 (blue). Bars, 10 μm. Enlarged images from the boxed areas demonstrate the co-localization of Tom20 with GFP-LC3 and/or with Parkin. E, the number of GFP-LC3 dots that were co-localized with mitochondria was quantified in Parkin-positive and Parkin-negative cells. *, p < 0.01, one-way ANOVA. _F_, the total number of GFP-LC3 dots was quantified in Parkin-positive and -negative cells. *, _p_ < 0.01. _n.s._, not significant (_p_ > 0.05), one-way ANOVA. All of the data shown are the means ± S.D.
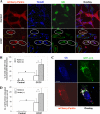
FIGURE 3.
Parkin promotes mitochondrial ubiquitination following CCCP treatment. A, HeLa cells were transfected with mCherry-Parkin for 24 h and then treated with CCCP (30 μ
m
) for 6 h. The cells were fixed and immunostained for Tom20 and ubiquitin (UB). Bars, 10 μm. The cells marked with yellow dotted ovals had no Parkin expression, in which ubiquitin signals were within the nucleus, whereas cells marked with white solid ovals had Parkin expression/translocation and ubiquitin labeling of Tom20-positive mitochondria. B, the percentage of cells with mitochondrial ubiquitin-positive dots was determined. *, p < 0.01, Z test. C and D, GFP-LC3-HeLa cells were transfected with mCherry-Parkin for 24 h and then treated with CCCP (30 μ
m
) for 6 h. The cells were fixed and immunostained for ubiquitin (Ub). Bars, 10 μm. The number of GFP-LC3 dots that were co-localized with ubiquitin-positive dots was quantified. *, p < 0.01, one-way ANOVA. All of the data shown are the means ± S.D.
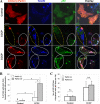
FIGURE 4.
Parkin promotes p62/SQSTM1 mitochondrial targeting following CCCP treatment. A, HeLa cells were transfected with mCherry-Parkin for 24 h and then treated with CCCP (30 μ
m
) for 6 h. The cells were fixed and immunostained for Tom20 and p62/SQSTM1. Bars, 10 μm. The cells marked with yellow dotted ovals had no Parkin expression, whereas cells marked with white solid ovals had Parkin expression and translocation, in which p62/SQSTM1 was also recruited to the mitochondria. B, the numbers of p62/SQSTM1 dots that co-localized with mitochondria per cell were quantified in Parkin-positive and -negative cells. *, p < 0.01, Z test. C, GFP-LC3-HeLa cells were transfected with mCherry-Parkin for 24 h and then treated with CCCP (30 μ
m
) for 6 h. The cells were fixed and stained for p62/SQSTM1. The number of GFP-LC3 dots that were co-localized with p62 were quantified. n.s., no significant difference (p > 0.05): one-way ANOVA. All of the data shown are the means ± S.D.
FIGURE 5.
Knockdown of p62 attenuates CCCP-induced mitophagy. A, GFP-LC3-HeLa cells were transfected with either negative siRNA or p62/SQSTM1-specific siRNA (120 n
m
) for 36 h and then treated with CCCP (30 μ
m
) for 6 h. The cells were fixed and immunostained for Tom20 and p62/SQSTM1. Bars, 10 μm. The cells marked with yellow dotted ovals had no p62/SQSTM1 expression in which LC3 was not co-localized with Tom20. The cells marked with white solid ovals expressed p62/SQSTM1 in which LC3 was co-localized with Tom20. B, the expression level of p62/SQSTM1 in control, negative, and specific siRNA-transfected cells. C and D, the number of mitochondria co-localized with GFP-LC3 dots/cell (C) and the total number of GFP-LC3 dots/cell (D) were quantified in p62/SQSTM1-positive and knockdown cells. *, p < 0.01; _n.s._, no significance (_p_ > 0.05), one-way ANOVA. E, HEK 293 cells stably expressing mCherry-Parkin cells were transfected with either negative siRNA or p62/SQSTM1-specific siRNA for 36 h. The cells were then treated with CCCP (30 μ
m
) for 6 h. The cells were fixed and immunostained for Tom20 and p62/SQSTM1. The number of Parkin-positive cells with less or no mitochondria was quantified in p62-positive and knockdown status. *, p < 0.01, Z test. All of the data shown are the means ± S.D.
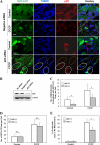
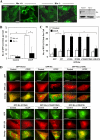
FIGURE 6.
CCCP-induced autophagy requires Nix. A, wild type (Nix+/+) and Nix-deficient (_Nix_−/−) MEFs expressing GFP-LC3 were treated with CCCP (30 μ
m
) for 6 h. The cells were fixed followed by confocal microscopy. Bars, 20 μm. The right panel shows an immunoblot analysis of Nix expression in these cells. B, the number of GFP-LC3 dots/cell was quantified. *, p < 0.01, one-way ANOVA. C and D, Nix−/− MEFs were co-transfected with the GFP vector, GFP-Nix, GFP-NixL124A, GFP-NixD129A, GFP-NixL124A/D129, or GFP-NixΔ188–219, together with RFP-LC3 for 24 h. The cells were then treated with CCCP (30 μm) for 6 h followed by fluorescence microscopy. The numbers of RFP-LC3 dots in each cell were quantified. *, p < 0.01, one-way ANOVA. All of the data shown are the means ± S.D. Bars, 20 μm. Note that both Leu124 and Asp129 are highly conserved among the BH3-only Bcl-2 family proteins in the BH3 domain. NixΔ188–219 is a C-terminal deletion mutant that also lacks the conserved transmembrane domain. WT, wild type.
FIGURE 7.
CCCP-induced autophagy requires ROS and is accompanied with mTOR inhibition. A and B, wild type (WT) and Nix−/− MEF were treated with CCCP for different times as indicated. The cells were harvested and stained for 15 min with tetramethylrhodamine methyl ester (TMRM, 2.5 μ
m
, A), which incorporates into mitochondria in a potential-dependent way, or dihydroethidium (2.5 μ
m
, B), which is converted to the red fluorescent product, ethidium, in the presence of superoxide, followed by flow cytometry. The mean fluorescence intensity was measured. *, p < 0.01, one-way ANOVA. C, wild type MEF stably expressing GFP-LC3 were treated with CCCP (30 μ
m
) in the presence or absence of NAC (20 m
m
) for 6 h. The cells were examined by confocal microscopy. Bar, 10 μm. D, the number of GFP-LC3 dots/cell was quantified. *, p < 0.01, one-way ANOVA. E, HeLa cells were treated as indicated with CCCP (30 μ
m
) or rapamycin (1 μ
m
) for 3 or 6 h. Total cell lysates were subjected to immunoblot analysis. F, HeLa cells were treated as indicated with CCCP (30 μ
m
) and/or NAC (10 m
m
) or MnTBAP (0.5 m
m
) for 6 h. Total cell lysates were subjected to immunoblot analysis. All of the data shown are the means ± S.D.
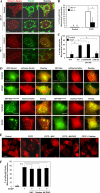
FIGURE 8.
CCCP-induced Parkin translocation is controlled by Nix but not by ROS. A and B, wild type (Nix +/+) and Nix-deficient (Nix −/−) MEFs were transfected with mCherry-Parkin for 24 h and then treated with CCCP (30 μ
m
) for 6 h. The cells were fixed and immunostained for Tom20 (A). Bars, 10 μm. The percentage of cells with Parkin mitochondrial translocation was quantified in Parkin-positive cells. *, p < 0.01, Z test. C and D, Nix−/− MEF cells were co-transfected with GFP vector or GFP-NIX or the mutants, together with mCherry-Parkin for 24 h, and then treated with CCCP (30 μm) for 6 h followed by fluorescence microscopy. Bars, 20 μm. The percentages of cells that had mitochondrial mCherry-Parkin translocation were quantified (means ± S.D.). *, p < 0.01, Z test. E and F, HeLa cells were transfected with mCherry-Parkin for 24 h and then treated with CCCP (20 μm) for 6 h in the presence or absence of NAC (10 m
m
), MnTBAP (0.5 m
m
), or catalase (1000 units/ml). The cells were examined by confocal microscopy (C). Bars, 20 μm. The percentage of cells with Parkin translocation was quantified in Parkin-positive cells (D). n.s., no significant difference (p > 0.05), one-way ANOVA. All of the data shown are the means ± S.D.
Similar articles
- Clearance of damaged mitochondria via mitophagy is important to the protective effect of ischemic preconditioning in kidneys.
Livingston MJ, Wang J, Zhou J, Wu G, Ganley IG, Hill JA, Yin XM, Dong Z. Livingston MJ, et al. Autophagy. 2019 Dec;15(12):2142-2162. doi: 10.1080/15548627.2019.1615822. Epub 2019 May 22. Autophagy. 2019. PMID: 31066324 Free PMC article. - p62/SQSTM1 is required for Parkin-induced mitochondrial clustering but not mitophagy; VDAC1 is dispensable for both.
Narendra D, Kane LA, Hauser DN, Fearnley IM, Youle RJ. Narendra D, et al. Autophagy. 2010 Nov;6(8):1090-106. doi: 10.4161/auto.6.8.13426. Autophagy. 2010. PMID: 20890124 Free PMC article. - Parkin-induced ubiquitination of Mff promotes its association with p62/SQSTM1 during mitochondrial depolarization.
Gao J, Qin S, Jiang C. Gao J, et al. Acta Biochim Biophys Sin (Shanghai). 2015 Jul;47(7):522-9. doi: 10.1093/abbs/gmv044. Epub 2015 May 24. Acta Biochim Biophys Sin (Shanghai). 2015. PMID: 26008206 - The reciprocal roles of PARK2 and mitofusins in mitophagy and mitochondrial spheroid formation.
Yin XM, Ding WX. Yin XM, et al. Autophagy. 2013 Nov 1;9(11):1687-92. doi: 10.4161/auto.24871. Epub 2013 May 21. Autophagy. 2013. PMID: 24162069 Review. - N-degron-mediated degradation and regulation of mitochondrial PINK1 kinase.
Eldeeb MA, Ragheb MA. Eldeeb MA, et al. Curr Genet. 2020 Aug;66(4):693-701. doi: 10.1007/s00294-020-01062-2. Epub 2020 Mar 10. Curr Genet. 2020. PMID: 32157382 Review.
Cited by
- Selective autophagy in cancer: mechanisms, therapeutic implications, and future perspectives.
Liu J, Wu Y, Meng S, Xu P, Li S, Li Y, Hu X, Ouyang L, Wang G. Liu J, et al. Mol Cancer. 2024 Jan 24;23(1):22. doi: 10.1186/s12943-024-01934-y. Mol Cancer. 2024. PMID: 38262996 Free PMC article. Review. - Mitophagy and heart failure.
Shires SE, Gustafsson ÅB. Shires SE, et al. J Mol Med (Berl). 2015 Mar;93(3):253-62. doi: 10.1007/s00109-015-1254-6. Epub 2015 Jan 23. J Mol Med (Berl). 2015. PMID: 25609139 Free PMC article. Review. - Evidence of Placental Autophagy during Early Pregnancy after Transfer of In Vitro Produced (IVP) Sheep Embryos.
Toschi P, Czernik M, Zacchini F, Fidanza A, Loi P, Ptak GE. Toschi P, et al. PLoS One. 2016 Jun 21;11(6):e0157594. doi: 10.1371/journal.pone.0157594. eCollection 2016. PLoS One. 2016. PMID: 27326761 Free PMC article. - Crosstalk Between Mammalian Autophagy and the Ubiquitin-Proteasome System.
Kocaturk NM, Gozuacik D. Kocaturk NM, et al. Front Cell Dev Biol. 2018 Oct 2;6:128. doi: 10.3389/fcell.2018.00128. eCollection 2018. Front Cell Dev Biol. 2018. PMID: 30333975 Free PMC article. Review. - Emerging views of mitophagy in immunity and autoimmune diseases.
Xu Y, Shen J, Ran Z. Xu Y, et al. Autophagy. 2020 Jan;16(1):3-17. doi: 10.1080/15548627.2019.1603547. Epub 2019 Apr 21. Autophagy. 2020. PMID: 30951392 Free PMC article.
References
- Nakatogawa H., Suzuki K., Kamada Y., Ohsumi Y. (2009) Nat. Rev. Mol. Cell Biol. 10, 458–467 - PubMed
- Kirkin V., McEwan D. G., Novak I., Dikic I. (2009) Mol. Cell 34, 259–269 - PubMed
Publication types
MeSH terms
Substances
Grants and funding
- P20 RR016475/RR/NCRR NIH HHS/United States
- R01 CA83817/CA/NCI NIH HHS/United States
- R21-AA017421/AA/NIAAA NIH HHS/United States
- P20 GM103418/GM/NIGMS NIH HHS/United States
- P20 RR021940/RR/NCRR NIH HHS/United States
- R01 HL059888/HL/NHLBI NIH HHS/United States
- R21 AA017421/AA/NIAAA NIH HHS/United States
- R01 CA111456/CA/NCI NIH HHS/United States
- R01 CA083817/CA/NCI NIH HHS/United States
LinkOut - more resources
Full Text Sources
Other Literature Sources
Miscellaneous

