Interaction between human prion protein and amyloid-beta (Abeta) oligomers: role OF N-terminal residues - PubMed (original) (raw)
Interaction between human prion protein and amyloid-beta (Abeta) oligomers: role OF N-terminal residues
Shugui Chen et al. J Biol Chem. 2010.
Abstract
Soluble oligomers of Abeta42 peptide are believed to play a major role in the pathogenesis of Alzheimer disease (AD). It was recently found that at least some of the neurotoxic effects of these oligomers may be mediated by specific binding to the prion protein, PrP(C), on the cell surface (Laurén, J., Gimbel, D. A., Nygaard, H. B., Gilbert, J. W., and Strittmatter, S. M. (2009) Nature 457, 1128-1132). Here we characterized the interaction between synthetic Abeta42 oligomers and the recombinant human prion protein (PrP) using two biophysical techniques: site-directed spin labeling and surface plasmon resonance. Our data indicate that this binding is highly specific for a particular conformation adopted by the peptide in soluble oligomeric species. The binding appears to be essentially identical for the Met(129) and Val(129) polymorphic forms of human PrP, suggesting that the role of PrP codon 129 polymorphism as a risk factor in AD is due to factors unrelated to the interaction with Abeta oligomers. It was also found that in addition to the previously identified approximately 95-110 segment, the second region of critical importance for the interaction with Abeta42 oligomers is a cluster of basic residues at the extreme N terminus of PrP (residues 23-27). The deletion of any of these segments results in a major loss of the binding function, indicating that these two regions likely act in concert to provide a high affinity binding site for Abeta42 oligomers. This insight may help explain the interplay between the postulated protective and pathogenic roles of PrP in AD and may contribute to the development of novel therapeutic strategies as well.
Figures
FIGURE 1.
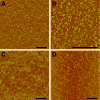
Atomic force microscopy images of different types of Aβ42 aggregates used in the present study. A, oligomers at low magnification; B, the same oligomers at higher magnification; C, amyloid fibrils; D, amyloid fibrils fragmented by sonication. The scale bars correspond to 1 μm.
FIGURE 2.
Binding of different forms of Aβ42 to full-length huPrP as probed by surface plasmon resonance. A, sensorgrams for soluble Aβ42 oligomers at different concentrations. The concentrations (in n
m
) are indicated as a number at each curve. The arrow indicates the end of the association phase (i.e. the point at which ligand-containing buffer was replaced with ligand-free buffer). RU, resonance units. B, sensorgrams for Aβ42 monomers, soluble oligomers, long fibrils, and fibrils fragmented by sonication (2 μ
m
in each case). huPrP (Met129 polymorphic form) was immobilized on the surface of a CM5 sensor chip at a density corresponding to ∼4000 resonance units.
FIGURE 3.
The effect of deletions in huPrP on Aβ42 binding as probed by surface plasmon resonance. A, schematic diagram of huPrP deletion variants used in this study. The unstructured N-terminal domain and the folded C-terminal domain are depicted in gray and black, respectively. The deleted regions are indicated as dashed bars. The disulphide bond between Cys179 and Cys214 is indicated by S-S. B and C, representative sensorgrams for binding of Aβ42 oligomers to deletion variants of huPrP (Met129 polymorphic form). Prion protein variants were immobilized on the surface of a CM5 sensor chip at a density corresponding to ∼4000 resonance units (RU) (4000 ± 300), and the Aβ42 oligomers were injected at a concentration of 2 μ
m
.
FIGURE 4.
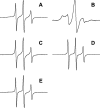
Binding of different forms of Aβ42 to full-length huPrP as probed by EPR spectroscopy. A, EPR spectrum for free huPrP labeled at residue 30 (30R huPrP) shows three relatively sharp features indicating high mobility of the nitroxide label. B, the spectrum of the protein in the presence of a saturating concentration of Aβ42 oligomers is characteristic of highly immobilized nitroxide label, indicating binding of huPrP to the oligomers. C–E, no huPrP binding was detected to Aβ42 monomer (C), Aβ42 amyloid fibrils (D), or fibrils fragmented by sonication (E). The concentration of 30R huPrP (Met129) was 2 μ
m
, and the concentration of Aβ42 was 100 μ
m
in each case. For visualization purposes, spectra are scaled to the same vertical size.
FIGURE 5.
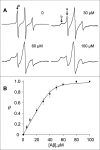
Determination of apparent equilibrium binding parameters for the interaction between Aβ42 oligomers and huPrP. A, representative EPR spectra for 30R huPrP at varying concentrations of Aβ42 oligomers. The concentration of 30R huPrP was 2 μ
m
, and the concentration of Aβ42 is shown at each spectrum. The intensity of the low field sharp feature (labeled a) is a measure of the amount of free huPrP; the broad feature b arises from 30R huPrP bound to Aβ42 oligomers. For visualization purposes, spectra are scaled to the same vertical size. B, binding isotherm for Aβ42 oligomer interaction with 30R huPrP. θ represents the fraction of bound 30R huPrP as determined from relative intensity of the low field sharp feature in EPR spectra (see “Results”). The equilibrium binding isotherm was analyzed according to Equation 3 (see “Experimental Procedures”), yielding the apparent dissociation constant, Kd, of 71 n
m
and the number of Aβ42 monomers per binding site of 21.
FIGURE 6.
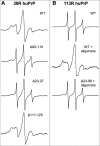
The effect of deletions in huPrP on Aβ42 binding as probed by EPR spectroscopy. A, EPR spectra for different deletion variants of huPrP labeled at position 30 (30R huPrP) in the presence of Aβ42 oligomers. B, EPR spectra for huPrP labeled at position 113 (113R huPrP) alone (top) and in the presence of Aβ42 oligomers (middle). The bottom spectrum represents Δ23–89 113R huPrP in the presence of Aβ42 oligomers. The lack of immobilized component in this spectrum indicates that the deletion of residues 23–89 completely abolishes huPrP binding to Aβ42 oligomers. In each case, the concentration of the prion protein and Aβ42 was 2 and 100 μ
m
, respectively. For visualization purposes, spectra are scaled to the same vertical size.
Similar articles
- High molecular mass assemblies of amyloid-β oligomers bind prion protein in patients with Alzheimer's disease.
Dohler F, Sepulveda-Falla D, Krasemann S, Altmeppen H, Schlüter H, Hildebrand D, Zerr I, Matschke J, Glatzel M. Dohler F, et al. Brain. 2014 Mar;137(Pt 3):873-86. doi: 10.1093/brain/awt375. Epub 2014 Feb 10. Brain. 2014. PMID: 24519981 - Amyloid-beta42 interacts mainly with insoluble prion protein in the Alzheimer brain.
Zou WQ, Xiao X, Yuan J, Puoti G, Fujioka H, Wang X, Richardson S, Zhou X, Zou R, Li S, Zhu X, McGeer PL, McGeehan J, Kneale G, Rincon-Limas DE, Fernandez-Funez P, Lee HG, Smith MA, Petersen RB, Guo JP. Zou WQ, et al. J Biol Chem. 2011 Apr 29;286(17):15095-105. doi: 10.1074/jbc.M110.199356. Epub 2011 Mar 10. J Biol Chem. 2011. PMID: 21393248 Free PMC article. - Soluble Prion Peptide 107-120 Protects Neuroblastoma SH-SY5Y Cells against Oligomers Associated with Alzheimer's Disease.
Rezvani Boroujeni E, Hosseini SM, Fani G, Cecchi C, Chiti F. Rezvani Boroujeni E, et al. Int J Mol Sci. 2020 Oct 1;21(19):7273. doi: 10.3390/ijms21197273. Int J Mol Sci. 2020. PMID: 33019683 Free PMC article. - Cellular prion protein mediates the toxicity of beta-amyloid oligomers: implications for Alzheimer disease.
Nygaard HB, Strittmatter SM. Nygaard HB, et al. Arch Neurol. 2009 Nov;66(11):1325-8. doi: 10.1001/archneurol.2009.223. Arch Neurol. 2009. PMID: 19901162 Free PMC article. Review. - Beta-amyloid oligomers and cellular prion protein in Alzheimer's disease.
Gunther EC, Strittmatter SM. Gunther EC, et al. J Mol Med (Berl). 2010 Apr;88(4):331-8. doi: 10.1007/s00109-009-0568-7. Epub 2009 Dec 4. J Mol Med (Berl). 2010. PMID: 19960174 Free PMC article. Review.
Cited by
- The neurodegeneration in Alzheimer disease and the prion protein.
Forloni G, Sclip A, Borsello T, Balducci C. Forloni G, et al. Prion. 2013 Jan-Feb;7(1):60-5. doi: 10.4161/pri.23286. Epub 2013 Jan 1. Prion. 2013. PMID: 23324596 Free PMC article. Review. - An N-terminal fragment of the prion protein binds to amyloid-β oligomers and inhibits their neurotoxicity in vivo.
Fluharty BR, Biasini E, Stravalaci M, Sclip A, Diomede L, Balducci C, La Vitola P, Messa M, Colombo L, Forloni G, Borsello T, Gobbi M, Harris DA. Fluharty BR, et al. J Biol Chem. 2013 Mar 15;288(11):7857-7866. doi: 10.1074/jbc.M112.423954. Epub 2013 Jan 28. J Biol Chem. 2013. PMID: 23362282 Free PMC article. - Identification of a Compound That Disrupts Binding of Amyloid-β to the Prion Protein Using a Novel Fluorescence-based Assay.
Risse E, Nicoll AJ, Taylor WA, Wright D, Badoni M, Yang X, Farrow MA, Collinge J. Risse E, et al. J Biol Chem. 2015 Jul 3;290(27):17020-8. doi: 10.1074/jbc.M115.637124. Epub 2015 May 20. J Biol Chem. 2015. PMID: 25995455 Free PMC article. - The 37kDa/67kDa laminin receptor acts as a receptor for Aβ42 internalization.
Da Costa Dias B, Jovanovic K, Gonsalves D, Moodley K, Reusch U, Knackmuss S, Weinberg MS, Little M, Weiss SF. Da Costa Dias B, et al. Sci Rep. 2014 Jul 3;4:5556. doi: 10.1038/srep05556. Sci Rep. 2014. PMID: 24990253 Free PMC article. - Physiological Functions of the Cellular Prion Protein.
Castle AR, Gill AC. Castle AR, et al. Front Mol Biosci. 2017 Apr 6;4:19. doi: 10.3389/fmolb.2017.00019. eCollection 2017. Front Mol Biosci. 2017. PMID: 28428956 Free PMC article. Review.
References
- Selkoe D. J. (2001) Physiol. Rev. 81, 741–766 - PubMed
- Selkoe D. J. (2002) Science 298, 789–791 - PubMed
- Hardy J., Selkoe D. J. (2002) Science 297, 353–356 - PubMed
- Goedert M., Spillantini M. G. (2006) Science 314, 777–781 - PubMed
Publication types
MeSH terms
Substances
LinkOut - more resources
Full Text Sources
Other Literature Sources
Research Materials
Miscellaneous


