DPARSF: A MATLAB Toolbox for "Pipeline" Data Analysis of Resting-State fMRI - PubMed (original) (raw)
DPARSF: A MATLAB Toolbox for "Pipeline" Data Analysis of Resting-State fMRI
Yan Chao-Gan et al. Front Syst Neurosci. 2010.
Abstract
Resting-state functional magnetic resonance imaging (fMRI) has attracted more and more attention because of its effectiveness, simplicity and non-invasiveness in exploration of the intrinsic functional architecture of the human brain. However, user-friendly toolbox for "pipeline" data analysis of resting-state fMRI is still lacking. Based on some functions in Statistical Parametric Mapping (SPM) and Resting-State fMRI Data Analysis Toolkit (REST), we have developed a MATLAB toolbox called Data Processing Assistant for Resting-State fMRI (DPARSF) for "pipeline" data analysis of resting-state fMRI. After the user arranges the Digital Imaging and Communications in Medicine (DICOM) files and click a few buttons to set parameters, DPARSF will then give all the preprocessed (slice timing, realign, normalize, smooth) data and results for functional connectivity, regional homogeneity, amplitude of low-frequency fluctuation (ALFF), and fractional ALFF. DPARSF can also create a report for excluding subjects with excessive head motion and generate a set of pictures for easily checking the effect of normalization. In addition, users can also use DPARSF to extract time courses from regions of interest.
Keywords: DPARSF; REST; SPM; data analysis; resting-state fMRI.
Figures
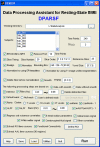
Figure 1
Graphical user interface of DPARSF.
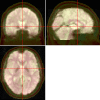
Figure 2
Pictures for checking normalization. The normalized functional image was overlaid on a high resolution 3D anatomical image (the opaque one with skull. From “Colin Holmes,”
http://imaging.mrc-cbu.cam.ac.uk/downloads/Colin/
, also distributed with MRIcroN as ch2) in the MNI space. Users can easily check the accuracy of spatial normalization by visual inspection.
Figure 3.
Within-condition patterns of ReHo (A), ALFF (B), fALFF (C) and PCC-FC (D). All these methods revealed the pattern of the default mode network. The numbers below the images refer to the MNI z coordinates. The statistical threshold was set at t > 3.89 (P < 0.0001) for one-tailed _t_-tests (for ReHo, ALFF and fALFF) and |_t_| > 4. 08 (P < 0.0001) for two-tailed _t_-test (for FC) and cluster size >135 mm3, which corresponds to a corrected P < 0.0001. LH, left hemisphere; RH, right hemisphere.
Similar articles
- PreSurgMapp: a MATLAB Toolbox for Presurgical Mapping of Eloquent Functional Areas Based on Task-Related and Resting-State Functional MRI.
Huang H, Ding Z, Mao D, Yuan J, Zhu F, Chen S, Xu Y, Lou L, Feng X, Qi L, Qiu W, Zhang H, Zang YF. Huang H, et al. Neuroinformatics. 2016 Oct;14(4):421-38. doi: 10.1007/s12021-016-9304-y. Neuroinformatics. 2016. PMID: 27221107 - Optimization of rs-fMRI parameters in the Seed Correlation Analysis (SCA) in DPARSF toolbox: A preliminary study.
Karpiel I, Klose U, Drzazga Z. Karpiel I, et al. J Neurosci Res. 2019 Apr;97(4):433-443. doi: 10.1002/jnr.24364. Epub 2018 Dec 21. J Neurosci Res. 2019. PMID: 30575101 - REST: a toolkit for resting-state functional magnetic resonance imaging data processing.
Song XW, Dong ZY, Long XY, Li SF, Zuo XN, Zhu CZ, He Y, Yan CG, Zang YF. Song XW, et al. PLoS One. 2011;6(9):e25031. doi: 10.1371/journal.pone.0025031. Epub 2011 Sep 20. PLoS One. 2011. PMID: 21949842 Free PMC article. - Regional homogeneity, functional connectivity and imaging markers of Alzheimer's disease: a review of resting-state fMRI studies.
Liu Y, Wang K, Yu C, He Y, Zhou Y, Liang M, Wang L, Jiang T. Liu Y, et al. Neuropsychologia. 2008;46(6):1648-56. doi: 10.1016/j.neuropsychologia.2008.01.027. Epub 2008 Feb 14. Neuropsychologia. 2008. PMID: 18346763 Review. - Mapping cognitive and emotional networks in neurosurgical patients using resting-state functional magnetic resonance imaging.
Catalino MP, Yao S, Green DL, Laws ER, Golby AJ, Tie Y. Catalino MP, et al. Neurosurg Focus. 2020 Feb 1;48(2):E9. doi: 10.3171/2019.11.FOCUS19773. Neurosurg Focus. 2020. PMID: 32006946 Free PMC article. Review.
Cited by
- Attention-Enhanced Fusion of Structural and Functional MRI for Analyzing HIV-Associated Asymptomatic Neurocognitive Impairment.
Fang Y, Wang W, Wang Q, Li HJ, Liu M. Fang Y, et al. Med Image Comput Comput Assist Interv. 2024 Oct;15011:113-123. doi: 10.1007/978-3-031-72120-5_11. Epub 2024 Oct 3. Med Image Comput Comput Assist Interv. 2024. PMID: 39463883 Free PMC article. - Repetitive subconcussion results in disrupted neural activity independent of concussion history.
Solar KG, Ventresca M, Zamyadi R, Zhang J, Jetly R, Vartanian O, Rhind SG, Dunkley BT. Solar KG, et al. Brain Commun. 2024 Oct 8;6(5):fcae348. doi: 10.1093/braincomms/fcae348. eCollection 2024. Brain Commun. 2024. PMID: 39440300 Free PMC article. - Classifying disorders of consciousness using a novel dual-level and dual-modal graph learning model.
Qi Z, Zeng W, Zang D, Wang Z, Luo L, Wu X, Yu J, Mao Y. Qi Z, et al. J Transl Med. 2024 Oct 21;22(1):950. doi: 10.1186/s12967-024-05729-z. J Transl Med. 2024. PMID: 39434088 Free PMC article. - Aberrant dynamic functional connectivity of thalamocortical circuitry in major depressive disorder.
Zheng W, Zhang Q, Zhao Z, Zhang P, Zhao L, Wang X, Yang S, Zhang J, Yao Z, Hu B. Zheng W, et al. J Zhejiang Univ Sci B. 2024 Feb 24;25(10):857-877. doi: 10.1631/jzus.B2300401. J Zhejiang Univ Sci B. 2024. PMID: 39420522 Free PMC article. - Intra-individual structural covariance network in schizophrenia patients with persistent auditory hallucinations.
Shao X, Ren H, Li J, He J, Dai L, Dong M, Wang J, Kong X, Chen X, Tang J. Shao X, et al. Schizophrenia (Heidelb). 2024 Oct 14;10(1):92. doi: 10.1038/s41537-024-00508-7. Schizophrenia (Heidelb). 2024. PMID: 39402082 Free PMC article.
References
LinkOut - more resources
Full Text Sources
Other Literature Sources


