Identification of an immediate Foxp3(-) precursor to Foxp3(+) regulatory T cells in peripheral lymphoid organs of nonmanipulated mice - PubMed (original) (raw)
Identification of an immediate Foxp3(-) precursor to Foxp3(+) regulatory T cells in peripheral lymphoid organs of nonmanipulated mice
Sonja Schallenberg et al. J Exp Med. 2010.
Abstract
CD4(+)CD25(+) regulatory T cells (T reg cells) expressing the transcription factor Foxp3 can be induced from peripheral T cell receptor (TCR) transgenic CD4(+)CD25(-)Foxp3(-) T cells stimulated with noninflammatory dendritic cells presenting low amounts of agonist cognate antigen. However, limited evidence exists for extra-thymic T reg cell generation from non-TCR transgenic T cells in unmanipulated mice. We compared events early during agonist-driven generation of Foxp3(+) TCR transgenic T cells to polyclonal CD4(+) T cell populations in unmanipulated mice. We identified an interleukin-2- and phosphatidylinositol-3-kinase-dependent precommitted Foxp3(-) precursor to Foxp3(+) T reg cells in peripheral lymphoid organs. Transforming growth factor beta signaling played a minor role in the generation and subsequent differentiation of these T reg precursor cells.
Figures
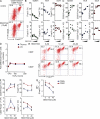
Figure 1.
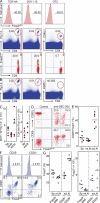
Tracking extrathymic differentiation of Ag-specific CD4+ T cells during DC-mediated Foxp3 induction. (A and B) Using clonotypic antibodies (TCR-HA107-119: 6.5, DO11.10: KJ1-26) or anti–Vα2/-Vβ5.1/5.2 antibodies (OT2), naive TCR transgenic T cells (CD4+CD25−CD62L+Foxp3_GFP_−) were FACS purified from Rag_-proficient Foxp3_GFP mice (A, top). 2 × 10⁶ cells were adoptively transferred i.v. into congenic recipients, which were injected i.p. with anti–DEC-205 antibodies fused to respective Ags (anti–DEC-205-HA107-119, 50 ng; anti–DEC-205-ovalbumin, 250 ng) the next day. Flow cytometry of congenic marker+ cells (A, middle) for induced Foxp3_GFP_ expression (A, bottom) at day 7 and percentages of congenic marker+ cells at day 14 in pools of LNs (B). (C) Numbers of transferred Thy1.2+DO11.10+ (left) or Thy1.2+TCR-HA107-119 (right) cells recovered from indicated organs at day 5 after injection of anti–DEC-205-ovalbumin or anti–DEC-205-HA107-119, respectively. (D–G) Analysis of transferred Thy1.2+DO11.10+ cells at day 5 after anti–DEC-205-ovalbumin injection. (D) Flow cytometry of scLN-derived Thy1.2+ cells for Foxp3_GFP_, CD62L, and CD69 expression. (E) Percentages of CD4+Thy1.2+Foxp3− cells with up-regulated CD25 expression recovered from indicated organs. Dots and horizontal lines in C and E indicate individual mice and mean values, respectively. (F) CD25+Foxp3− and CD25−Foxp3− subsets among Thy1.2+DO11.10+ cells from scLNs of Foxp3_GFP_ mice were FACS purified from recipients at day 5 after transfer (top). CD25 and Foxp3_GFP_ expression was determined at day 3 of IL-2–containing cultures (bottom). (G) Percentages (left) and numbers (right) of Foxp3_GFP_-expressing cells at day 3 of cultures of initially Foxp3−DO11.10+ cells, which were isolated from spleen or mLNs irrespective of their CD25 expression (Foxp3− total), or isolated from scLNs based on CD25−Foxp3− or CD25+Foxp3− expression. Numbers in histograms and dot plots indicate the percentage of gated cells in respective quadrants or gates. Dots and horizontal lines indicate replicate wells and mean values, respectively. Data are representative of at least three independent experiments with pooled cells of three to six mice.
Figure 2.
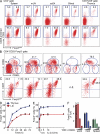
Tracking extrathymic differentiation of polyclonal CD4+CD25+Foxp3− T cell precursors to Foxp3+ cells in nonmanipulated mice. (A) Flow cytometry of CD25 and Foxp3_GFP_ expression among gated CD4+ cells of indicated origin before (top) and after (bottom) magnetic bead enrichment of CD25+ cells. Numbers in dot plots indicate the percentage of gated cells within the respective gate. (B) Flow cytometry of CD69 and CD62L expression among gated CD4+CD25+Foxp3− cells from anatomical locations as indicated in A. (C) CD4+CD25+Foxp3− cells from secondary lymphoid organs and CD4+CD8−TCRβ+CD25+Foxp3− cells from thymus were purified by flow cytometry and CD25 and Foxp3_GFP_ expression was assessed at day 3 of IL-2–containing cultures (n.d., not detectable). (D–F) Analysis of CD4+CD25+Foxp3− cells from indicated lymphoid organs of Foxp3_GFP_ mice for their capacity to up-regulate Foxp3_GFP_ expression in the presence of 1,000 U/ml IL-2 at indicated time points of culture (D), in the presence of indicated amounts of IL-2 at day 3 of culture (E), and in the presence of 1,000 U/ml IL-2 and titrating amounts of LY294002 (0, 2.5, 10, or 40 µM) at day 3 of culture (F). Data are representative of at least two independent experiments. Error bars indicate SD of triplicate wells.
Figure 3.
Characterization of CD4+CD25+Foxp3− precursor and differentiated Foxp3+ T cells. (A) Differentiation of CD4+CD25+Foxp3− precursors to Foxp3+ T cells in vivo. CD4+CD25+Foxp3−Thy1.2+ cells were FACS purified from LNs of Foxp3_GFP_ mice. Presort analysis among gated CD4+ cells after magnetic bead enrichment of CD25+ cells (top left) and postsort analysis (bottom left) are depicted. FACS-purified cells (4 × 10⁴) were injected i.v. into immunocompetent congenic recipients. Thy1.2+ cells were analyzed for CD25 and Foxp3_GFP_ expression at days 3 and 6. Numbers in dot plots indicate percentages of gated cells in the respective quadrant or gate. (B and C) Stability of in vitro–differentiated CD4+CD25+Foxp3+ T cells in vivo. CD4+CD25+Foxp3−Thy1.2+ cells were cultured in the presence of IL-2. At day 3, total cells (2 × 10⁵) were coinjected i.v. with naive CD62L+CD25−Foxp3−Thy1.1+CD4+ T cells (8 × 10⁶) into Rag_2−/− mice (B) or total cells (4 × 10⁴) were injected alone into immunocompetent congenic recipients (C). Foxp3_GFP expression of congenic marker+CD4+ cells in LNs (B and C) and spleen (C) of recipients was tracked at indicated time points. (D) Suppressor function in vitro. CFSE-labeled CD4+CD25− T responder (Tresp) cells were cultured with irradiated splenocytes and anti-CD3ε antibodies, either alone or co-cultured with CD25+Foxp3+ T cells originating from CD4+CD25+Foxp3− precursor cells (Foxp3−→Foxp3+) or freshly isolated CD4+CD25+Foxp3+ T reg cells (Foxp3+). Median fluorescence intensity (MFI) of CD25 staining (left) and CFSE dilution (right) of T responder cells was determined at day 3. Division cycles of T responder cells are indicated by arrowheads. Colors of bars mirror those of histograms. (E) Suppressor function in vivo. Naive CD62L+CD25−Foxp3−Thy1.1+CD4+ T cells (5 × 10⁶) were injected into _Rag_2−/− mice alone or together with 105 total cells from IL-2–containing differentiation cultures of Foxp3− precursors as shown in B (bottom left). Data are representative of at least two independent experiments including three to four mice. Dots represent individual mice, and horizontal bars indicate mean values.
Figure 4.
Differentiation capacities of CD4+CD25+Foxp3− precursor subsets. (A and B) Total CD4+CD25+Foxp3− populations (A) or CD62L−CD69−, CD62LintCD69+ and CD62L+CD69− subsets (B) among gated CD4+CD25+Foxp3− cells were FACS purified from indicated lymphoid organs of Foxp3_GFP_ mice, cultured in the presence of IL-2, and analyzed by flow cytometry for up-regulated Foxp3_GFP_ expression at day 3 of cultures. Numbers in dot plots and histograms indicate the percentage of gated cells in the respective quadrant or gate. (C) Percentages (left) and absolute numbers (right) of Foxp3_GFP_+ cells originating from total populations of initially CD4+CD25+Foxp3− cells or populations that were subfractionated based on differential CD62L and CD69 expression, as indicated. Error bars indicate SD of triplicate wells. (D) Pacific Blue–succinimidyl ester (Pacific Blue–SE)–labeled CD4+CD25+Foxp3− cells from scLNs or thymus of Foxp3_GFP_ mice were cultured in the presence of IL-2 and were analyzed by flow cytometry at day 3 for up-regulated Foxp3_GFP_ expression and cell division, as revealed by dilution of Pacific Blue–succinimidyl ester. Division cycles are indicated by arrowheads. Numbers in dot plots indicate the percentages of undivided and divided cells among Foxp3+ cells. (E) Flow cytometry of CD62L and CD69 expression among gated CD25+Foxp3− and CD25+Foxp3+ cells at day 3 of IL-2–containing cultures of CD4+CD25+Foxp3− precursor cells from thymus or LNs of Foxp3_GFP_ mice. See Fig. 2 for comparison with CD4+CD25+Foxp3− precursor cells before in vitro differentiation. Data are representative of at least two independent experiments.
Figure 5.
mRNA expression in CD4+CD25+Foxp3− precursor subsets and differentiated CD25+Foxp3+ T reg cells. Expression of mRNA encoding indicated T cell lineage transcription factors (A) and selected T reg cell signature genes (B) was determined by real-time RT-PCR in freshly isolated CD4+CD25+Foxp3− precursor subsets presented in Fig. 4 B. Freshly isolated scLN-derived CD4+CD25+Foxp3+ cells and conventional CD4+ T cells that had been cultured under Th1-, Th2-, or Th17-polarizing conditions were included as positive controls as indicated. CD25+Foxp3+ T cells that were in vitro differentiated from CD4+CD25+Foxp3− precursor cells (Foxp3−→Foxp3+) and purified by flow cytometry at day 3 of culture based on Foxp3_GFP_ expression are also included. β-Actin was used for normalization. Shown are mean and range of duplicate samples. Data are representative of at least two independent experiments.
Figure 6.
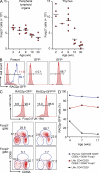
Contribution of the thymus to the peripheral pool of CD4+CD25+Foxp3− T reg precursor cells. (A) Approximation of Foxp3+ T reg cell numbers produced in peripheral lymphoid organs and thymus. For this, total numbers of CD4+CD25+Foxp3− cells in peripheral lymphoid organs (spleen, mLNs, and a set of scLNs; see Materials and methods) or thymus of individual Foxp3_GFP_ mice were determined. Equivalent numbers of FACS-purified peripheral and thymic precursor populations were cultured in the presence of IL-2, and absolute numbers of Foxp3+ cells were determined at day 3 of culture. Estimated contribution of precursor populations to the peripheral T reg cell pool was calculated as follows: [total numbers CD4+CD25+Foxp3− cells ex vivo] × [absolute numbers Foxp3+ cells in vitro] ÷ [absolute numbers CD25+Foxp3− cells culture input]. Each dot represents an individual mouse of indicated age, and horizontal bars indicate mean values. (B–D) Contribution of RTEs to the peripheral pool of Foxp3− precursor cells. (B) Left histogram is gated on CD4+CD25+ T cells from LNs of 7-wk-old RAG2p-GFP mice (red filled histograms). Blue histogram depicts CD4+CD8− thymocytes. Right histograms show postsort isolation of GFP− and GFP+ subsets. Numbers in histograms show the percentages of GFPhigh cells within the indicated gate. (C) Foxp3 expression, as revealed by intracellular staining using the mAb FJK-16s, in FACS-purified peripheral CD4+CD25+ T cells that were RAG2p-GFP− or RAG2p-GFPhigh, and CD62L and CD69 expression among gated CD4+CD25+Foxp3− (middle) and CD4+CD25+Foxp3+ T cells (bottom). (D) Percentages of RAG2p-GFPhigh cells among indicated thymic and peripheral populations from RAG2p-GFP mice at indicated ages. Data are representative of at least two independent experiments.
Figure 7.
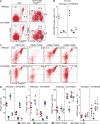
Characterization of extrathymic T reg cell differentiation in mice with abrogated TGF-βR signaling. (A) Representative flow cytometry of CD69 and CD62L expression among gated CD4+CD25+Foxp3− cells from scLNs of 2-wk-old dnTGF-βRII and WT age-matched littermate control Foxp3_GFP_ mice. Numbers in dot plots indicate the percentage of gated cells in the respective quadrant or gate. (B) Absolute numbers of CD4+CD25+Foxp3− cells and indicated subsets among gated CD4+CD25+Foxp3− cells presented in A. Each dot represents an individual mouse. (C) Differentiation of CD25+Foxp3+ cells from FACS-purified total CD4+CD25+Foxp3− populations or indicated subsets among CD4+CD25+Foxp3− cells from scLNs of WT control (top) and dnTGF-βRII (bottom) Foxp3_GFP_ mice at day 3 of IL-2–containing cultures. (D) Percentages and absolute numbers of CD25+Foxp3+ and CD25+Foxp3− cells originating from WT and dnTGF-βRII mice presented in C. Data are representative of two independent experiments with three mice per group. Each dot represents an individual triplicate well per condition, and horizontal bars indicate mean values.
Figure 8.
Impact of TGF-βR signaling deprivation or enhancement on extrathymic T reg precursor cell differentiation in vitro. (A–C) CD4+CD25+ CD62LintCD69+Foxp3− cells were FACS purified from pools of spleen, mLNs, and scLNs of Foxp3_GFP_ mice and cultured with IL-2 in the absence or presence of titrating amounts (2.5, 10, and 40 µM) of the Smad kinase inhibitor SB431542. (A) Representative flow cytometry of CD25 and Foxp3_GFP_ expression at day 3 of cultures. Numbers in dot plots indicate the percentage of gated cells in the respective quadrant. (B and C) Percentages (top) and absolute numbers (bottom) of CD25+Foxp3+ (B) and CD25+Foxp3− (C) cells recovered from these cultures. Dots and horizontal lines indicate individual replicate wells and mean values, respectively. Efficient abrogation of TGF-β–mediated Foxp3 induction in TCR-stimulated conventional naive CD4+ T cells by SB431542 is shown in Fig. S4 B. (D) FACS-purified CD4+CD25+Foxp3− cells from scLNs and CD4+CD8−TCR-β+CD25+Foxp3− cells from thymus of Foxp3_GFP_ mice were cultured with IL-2 in the presence of titrating amounts of human TGF-β1, as indicated. At day 3 of cultures, the impact of TGF-β was calculated as fold difference of numbers of Foxp3+ cells as follows: [absolute numbers Foxp3+ cells from cultures with added TGF-β] ÷ [absolute numbers Foxp3+ cells from cultures without added TGF-β]. (E–G) CD25−Foxp3− and CD25+Foxp3− cells among Thy1.2+DO11.10+ T cells were FACS purified at day 5 after adoptive transfer into congenic recipients and subsequent anti–DEC-205-ovalbumin injection. IL-2–containing cultures with indicated amounts of SB431542 were analyzed at day 3 for CD25 and Foxp3_GFP_ expression. (E) Representative flow cytometric analysis. (F) Percentages (top) and absolute numbers (bottom) of CD25+Foxp3− (left) and CD25+Foxp3+ (right) cells recovered from these cultures. (G) Median fluorescence intensities (MFI) of Foxp3_GFP_ expression. Shown are the mean and SD of triplicate wells. Data are representative of at least two independent experiments.
Similar articles
- Diacylglycerol kinase ζ limits the generation of natural regulatory T cells.
Schmidt AM, Zou T, Joshi RP, Leichner TM, Pimentel MA, Sommers CL, Kambayashi T. Schmidt AM, et al. Sci Signal. 2013 Nov 26;6(303):ra101. doi: 10.1126/scisignal.2004411. Sci Signal. 2013. PMID: 24280042 Free PMC article. - TGFbeta1 deficiency does not affect the generation and maintenance of CD4+CD25+FOXP3+ putative Treg cells, but causes their numerical inadequacy and loss of regulatory function.
Bommireddy R, Babcock GF, Singh RR, Doetschman T. Bommireddy R, et al. Clin Immunol. 2008 May;127(2):206-13. doi: 10.1016/j.clim.2007.12.008. Epub 2008 Mar 4. Clin Immunol. 2008. PMID: 18308639 Free PMC article. - Regulatory T cells expressing interleukin 10 develop from Foxp3+ and Foxp3- precursor cells in the absence of interleukin 10.
Maynard CL, Harrington LE, Janowski KM, Oliver JR, Zindl CL, Rudensky AY, Weaver CT. Maynard CL, et al. Nat Immunol. 2007 Sep;8(9):931-41. doi: 10.1038/ni1504. Epub 2007 Aug 12. Nat Immunol. 2007. PMID: 17694059 - Development of thymic Foxp3(+) regulatory T cells: TGF-β matters.
Chen W, Konkel JE. Chen W, et al. Eur J Immunol. 2015 Apr;45(4):958-65. doi: 10.1002/eji.201444999. Epub 2015 Mar 18. Eur J Immunol. 2015. PMID: 25684698 Free PMC article. Review. - Human regulatory T cells: a unique, stable thymic subset or a reversible peripheral state of differentiation?
Pillai V, Karandikar NJ. Pillai V, et al. Immunol Lett. 2007 Nov 30;114(1):9-15. doi: 10.1016/j.imlet.2007.08.012. Epub 2007 Sep 29. Immunol Lett. 2007. PMID: 17945352 Free PMC article. Review.
Cited by
- Cellular and molecular determinants for the development of natural and induced regulatory T cells.
Yuan X, Malek TR. Yuan X, et al. Hum Immunol. 2012 Aug;73(8):773-82. doi: 10.1016/j.humimm.2012.05.010. Epub 2012 Jun 1. Hum Immunol. 2012. PMID: 22659217 Free PMC article. Review. - Therapeutic application of T regulatory cells in composite tissue allotransplantation.
Yang JH, Eun SC. Yang JH, et al. J Transl Med. 2017 Oct 26;15(1):218. doi: 10.1186/s12967-017-1322-5. J Transl Med. 2017. PMID: 29073905 Free PMC article. Review. - Regulatory T cells: mechanisms of differentiation and function.
Josefowicz SZ, Lu LF, Rudensky AY. Josefowicz SZ, et al. Annu Rev Immunol. 2012;30:531-64. doi: 10.1146/annurev.immunol.25.022106.141623. Epub 2012 Jan 6. Annu Rev Immunol. 2012. PMID: 22224781 Free PMC article. Review. - A requisite role for induced regulatory T cells in tolerance based on expanding antigen receptor diversity.
Haribhai D, Williams JB, Jia S, Nickerson D, Schmitt EG, Edwards B, Ziegelbauer J, Yassai M, Li SH, Relland LM, Wise PM, Chen A, Zheng YQ, Simpson PM, Gorski J, Salzman NH, Hessner MJ, Chatila TA, Williams CB. Haribhai D, et al. Immunity. 2011 Jul 22;35(1):109-22. doi: 10.1016/j.immuni.2011.03.029. Epub 2011 Jun 30. Immunity. 2011. PMID: 21723159 Free PMC article. - Protein phosphatase 6 (Pp6) is crucial for regulatory T cell function and stability in autoimmunity.
Cai W, Zhang J, Zhou H, Li X, Lou F, Sun Y, Xu Z, Bai J, Yin Q, Wang Z, Sun L, Cai X, Tang S, Wu Y, Fan L, Wang H, Wang H, Li Q. Cai W, et al. Genes Dis. 2021 Aug 17;9(2):562-575. doi: 10.1016/j.gendis.2021.07.005. eCollection 2022 Mar. Genes Dis. 2021. PMID: 35224167 Free PMC article.
References
- Apostolou I., Sarukhan A., Klein L., von Boehmer H. 2002. Origin of regulatory T cells with known specificity for antigen. Nat. Immunol. 3:756–763 - PubMed
Publication types
MeSH terms
Substances
LinkOut - more resources
Full Text Sources
Medical
Molecular Biology Databases
Research Materials
