Identification of eukaryotic and prokaryotic methylthiotransferase for biosynthesis of 2-methylthio-N6-threonylcarbamoyladenosine in tRNA - PubMed (original) (raw)
Identification of eukaryotic and prokaryotic methylthiotransferase for biosynthesis of 2-methylthio-N6-threonylcarbamoyladenosine in tRNA
Simon Arragain et al. J Biol Chem. 2010.
Abstract
Bacterial and eukaryotic transfer RNAs have been shown to contain hypermodified adenosine, 2-methylthio-N(6)-threonylcarbamoyladenosine, at position 37 (A(37)) adjacent to the 3'-end of the anticodon, which is essential for efficient and highly accurate protein translation by the ribosome. Using a combination of bioinformatic sequence analysis and in vivo assay coupled to HPLC/MS technique, we have identified, from distinct sequence signatures, two methylthiotransferase (MTTase) subfamilies, designated as MtaB in bacterial cells and e-MtaB in eukaryotic and archaeal cells. Both subfamilies are responsible for the transformation of N(6)-threonylcarbamoyladenosine into 2-methylthio-N(6)-threonylcarbamoyladenosine. Recently, a variant within the human CDKAL1 gene belonging to the e-MtaB subfamily was shown to predispose for type 2 diabetes. CDKAL1 is thus the first eukaryotic MTTase identified so far. Using purified preparations of Bacillus subtilis MtaB (YqeV), a CDKAL1 bacterial homolog, we demonstrate that YqeV/CDKAL1 enzymes, as the previously studied MTTases MiaB and RimO, contain two [4Fe-4S] clusters. This work lays the foundation for elucidating the function of CDKAL1.
Figures
SCHEME 1.
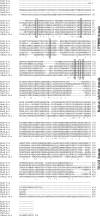
Amino acid sequence alignments of MiaB, RimO, and MtaB (YqeV and Cdkal-1) MTTases from T. maritima (T.m.), E. coli (E.c.), B. subtilis (B.sm.), and Homo sapiens (H.s.). The alignment was performed with ClustalW at the EBI site. Totally conserved residues are indicated by asterisks, and conserved cysteine residues are shown in boxes. The three domains UPF0004, radical AdoMet, and TRAM are shown on the right.
SCHEME 2.
Biosynthetic pathway for ms2t6A.
FIGURE 1.
Phylogenomic analysis of bacterial and human radical AdoMet methylthiotransferases. The cladogram shows the inferred evolutionary distances between representatives of all homologous protein families identified in a systematic search of the human genome and 474 fully sequenced bacterial genomes (see “Materials and Methods”). The MiaB and RimO families have been biochemically characterized in previous literature. This study described initial experimental characterization of representatives from the
m
ethyl
t
hio
t
hreonylcarbamoyl
a
denosine transferase B (MtaB) family and the
e
ukaryotic
m
ethyl
t
hio
t
hreonylcarbamoyl
a
denosine transferase B (e-MtaB) family. The
m
e
t
hY
t
hio
t
ransferase-
l
ike family 1 (MTL1), which is restricted to ϵ proteobacteria, has yet to be characterized experimentally. The e-MtaB family is found in archaebacteria but not eubacteria, although the other four families are found in eubacteria but not archaebacteria. The organism count indicates the number of unrelated bacterial genomes that encode a representative of each family (i.e. after correction for redundancy in genome organization). The numbers in circles at the root of each family indicate the number of times a member of one of the other families shown here is encoded simultaneously in the same genome (without redundancy correction). The numbers in a smaller font near the branch points indicate the percent of MEGA bootstrap replicates with the illustrated relative ordering of the successive branch points. Splits between the identified families confidently precede those within the families, with 100, 78, 98, and 99% confidence. Proper grouping of proteins in the MtaB family, which has the lowest 78% confidence for its first internal split, is supported by PSI-BLAST sequence profiling (data not shown) as well as the fact that proteins assigned to this family are never encoded in the same genome, even though 198 members of the other families are found encoded in the same genome as MtaB family members. The ORF data in parentheses includes the name of the protein, its amino acid sequence length, its overall pI, and the pI of its TRAM domain. The TRAM domains of bacterial MiaBs are generally basic, although those of bacterial RimOs are generally acidic. The TRAM domains of members of the other families show wider variations in pI values.
FIGURE 2.
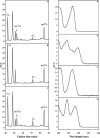
HPLC, UV-visible detection, and mass spectra of i6A, t6A, and ms2t6A modified nucleosides using E. coli. The chromatograms correspond to the analysis (45–90-min region) of bulk tRNA from the following: _miaB_− TX3346 E. coli strain (A), complemented with pT7-mtab (B) and pT7-emtab (C). The UV-visible spectra of the i6A (D), t6A (E) and ms2t6A (F) and the corresponding mass t6A (G) ms2t6A obtained after complementation with pT7-mtab (H), pT7-emtab (I). The experiments have been run in triplicate, and the areas have been found to be reproducible within a 5% margin error. Mass spectrometry detection was carried out in neutral loss mode to obtain a high specificity as described under “Materials and Methods.” The peak denoted with asterisk corresponds to the Na+-protonated pseudo-molecular ions for t6A (G) (MH+ = 435.5) and ms2t6A (H and I) (MH+ = 481.3). mAU, milli-arbitrary units.
FIGURE 3.
HPLC and UV-visible detection of t6A, ms2t6A, i6A, and ms2i6A modified nucleosides using B. subtilis. The chromatograms correspond to the analysis (45–90-min region) of bulk tRNA from the following: MGNA-001 B. subtilis wild-type strain (A); MGNA-C496 _B. subtilis yqeV_− strain (B); MGNA-C496 _B. subtilis yqeV_− strain complemented with the pDB148-yqeV plasmid (C). The UV-visible spectra of the t6A (D), ms2t6A (E), i6A (F), and ms2i6A (G) are shown. The experiments have been run in triplicate, and the areas have been found to be reproducible within a 5% margin error. mAU, milli-arbitrary units.
FIGURE 4.
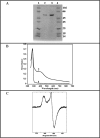
Biochemical and spectroscopic characterization of MtaB protein. A, SDS-polyacrylamide (12%) gel of MtaB after Superdex 75 chromatography (2 and 6 μg, lanes 2 and 3, respectively). Molecular weight markers are in lanes 1 and 4. B, light absorption spectra of apo-MtaB (4 μ
m
) (trace 1) and holo-MtaB (8 μ
m
) (trace 2) MtaB in 50 m
m
Tris-Cl, pH 8.0, with 50 m
m
KCl. C, X-band EPR spectrum of the reduced holo-MtaB (100 μ
m
) MtaB in 50 m
m
Tris-Cl, pH 8.0, with 50 m
m
KCl. Experimental conditions are as follows: microwave power, 100 microwatts; microwave frequency, 9.6 GHz; modulation amplitude 1 millitesla; temperature 12 K.
Similar articles
- Functional characterization of the YmcB and YqeV tRNA methylthiotransferases of Bacillus subtilis.
Anton BP, Russell SP, Vertrees J, Kasif S, Raleigh EA, Limbach PA, Roberts RJ. Anton BP, et al. Nucleic Acids Res. 2010 Oct;38(18):6195-205. doi: 10.1093/nar/gkq364. Epub 2010 May 14. Nucleic Acids Res. 2010. PMID: 20472640 Free PMC article. - Identification of 2-methylthio cyclic N6-threonylcarbamoyladenosine (ms2ct6A) as a novel RNA modification at position 37 of tRNAs.
Kang BI, Miyauchi K, Matuszewski M, D'Almeida GS, Rubio MAT, Alfonzo JD, Inoue K, Sakaguchi Y, Suzuki T, Sochacka E, Suzuki T. Kang BI, et al. Nucleic Acids Res. 2017 Feb 28;45(4):2124-2136. doi: 10.1093/nar/gkw1120. Nucleic Acids Res. 2017. PMID: 27913733 Free PMC article. - Characterization of RimO, a new member of the methylthiotransferase subclass of the radical SAM superfamily.
Lee KH, Saleh L, Anton BP, Madinger CL, Benner JS, Iwig DF, Roberts RJ, Krebs C, Booker SJ. Lee KH, et al. Biochemistry. 2009 Oct 27;48(42):10162-74. doi: 10.1021/bi900939w. Biochemistry. 2009. PMID: 19736993 Free PMC article. - Functional loss of Cdkal1, a novel tRNA modification enzyme, causes the development of type 2 diabetes.
Wei FY, Tomizawa K. Wei FY, et al. Endocr J. 2011;58(10):819-25. doi: 10.1507/endocrj.ej11-0099. Epub 2011 Sep 8. Endocr J. 2011. PMID: 21908934 Review. - Diversity of the biosynthesis pathway for threonylcarbamoyladenosine (t(6)A), a universal modification of tRNA.
Thiaville PC, Iwata-Reuyl D, de Crécy-Lagard V. Thiaville PC, et al. RNA Biol. 2014;11(12):1529-39. doi: 10.4161/15476286.2014.992277. RNA Biol. 2014. PMID: 25629598 Free PMC article. Review.
Cited by
- S-adenosylmethionine tRNA modification: unexpected/unsuspected implications of former/new players.
Adami R, Bottai D. Adami R, et al. Int J Biol Sci. 2020 Sep 30;16(15):3018-3027. doi: 10.7150/ijbs.49302. eCollection 2020. Int J Biol Sci. 2020. PMID: 33061813 Free PMC article. Review. - Identification of a radical SAM enzyme involved in the synthesis of archaeosine.
Yokogawa T, Nomura Y, Yasuda A, Ogino H, Hiura K, Nakada S, Oka N, Ando K, Kawamura T, Hirata A, Hori H, Ohno S. Yokogawa T, et al. Nat Chem Biol. 2019 Dec;15(12):1148-1155. doi: 10.1038/s41589-019-0390-7. Epub 2019 Nov 18. Nat Chem Biol. 2019. PMID: 31740832 - tRNA methyltransferase homolog gene TRMT10A mutation in young onset diabetes and primary microcephaly in humans.
Igoillo-Esteve M, Genin A, Lambert N, Désir J, Pirson I, Abdulkarim B, Simonis N, Drielsma A, Marselli L, Marchetti P, Vanderhaeghen P, Eizirik DL, Wuyts W, Julier C, Chakera AJ, Ellard S, Hattersley AT, Abramowicz M, Cnop M. Igoillo-Esteve M, et al. PLoS Genet. 2013 Oct;9(10):e1003888. doi: 10.1371/journal.pgen.1003888. Epub 2013 Oct 31. PLoS Genet. 2013. PMID: 24204302 Free PMC article. - Recent advances in radical SAM enzymology: new structures and mechanisms.
Wang J, Woldring RP, Román-Meléndez GD, McClain AM, Alzua BR, Marsh EN. Wang J, et al. ACS Chem Biol. 2014 Sep 19;9(9):1929-38. doi: 10.1021/cb5004674. Epub 2014 Jul 16. ACS Chem Biol. 2014. PMID: 25009947 Free PMC article. Review. - On the Role of Additional [4Fe-4S] Clusters with a Free Coordination Site in Radical-SAM Enzymes.
Mulliez E, Duarte V, Arragain S, Fontecave M, Atta M. Mulliez E, et al. Front Chem. 2017 Mar 16;5:17. doi: 10.3389/fchem.2017.00017. eCollection 2017. Front Chem. 2017. PMID: 28361051 Free PMC article. Review.
References
- Fontecave M., Mulliez E., Atta M. (2008) Chem. Biol. 15, 209–210 - PubMed
- Pierrel F., Douki T., Fontecave M., Atta M. (2004) J. Biol. Chem. 279, 47555–47563 - PubMed
Publication types
MeSH terms
Substances
LinkOut - more resources
Full Text Sources
Other Literature Sources
Molecular Biology Databases


