miR-375 inhibits differentiation of neurites by lowering HuD levels - PubMed (original) (raw)
miR-375 inhibits differentiation of neurites by lowering HuD levels
Kotb Abdelmohsen et al. Mol Cell Biol. 2010 Sep.
Abstract
Neuronal development and plasticity are maintained by tightly regulated gene expression programs. Here, we report that the developmentally regulated microRNA miR-375 affects dendrite formation and maintenance. miR-375 overexpression in mouse hippocampus potently reduced dendrite density. We identified the predominantly neuronal RNA-binding protein HuD as a key effector of miR-375 influence on dendrite maintenance. Heterologous reporter analysis verified that miR-375 repressed HuD expression through a specific, evolutionarily conserved site on the HuD 3' untranslated region. miR-375 overexpression lowered both HuD mRNA stability and translation and recapitulated the effects of HuD silencing, which reduced the levels of target proteins with key functions in neuronal signaling and cytoskeleton organization (N-cadherin, PSD-95, RhoA, NCAM1, and integrin alpha1). Moreover, the increase in neurite outgrowth after brain-derived neurotrophic factor (BDNF) treatment was diminished by miR-375 overexpression; this effect was rescued by reexpression of miR-375-refractory HuD. Our findings indicate that miR-375 modulates neuronal HuD expression and function, in turn affecting dendrite abundance.
Figures
FIG. 1.
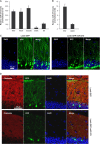
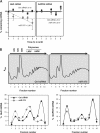
Endogenous and ectopic expression of miR-375. (A) The levels of miR-375 in the mouse tissues shown were quantified by RT-qPCR analysis and normalized to the levels of U1 (also measured by RT-qPCR). (B) miR-375 abundance in embryonic telencephalon and in adult cortex were measured by RT-qPCR analysis and normalized to the levels of U6 (also measured by RT-qPCR). The error bars indicate standard deviations. (C) Lenti-GFP (control) or Lenti-GFP-miR-375 was injected into mouse hippocampus (dentate gyrus); 4 weeks later, tissue sections were prepared for analysis by confocal microscopy. DAPI (4′,6-diamidino-2-phenylindole), staining of nuclei; GFP, infected cells in a given plane of microscopy. (D) Rhodamine-phalloidin was used to stain the actin cytoskeleton in cells that were infected and processed as explained in the legend to panel C.
FIG. 2.
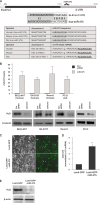
miR-375 overexpression lowers HuD abundance. (A) (Top) Schematic of HuD mRNA depicting the 5′ UTR (white), coding region (black), and 3′ UTR (gray). The interaction between the human (hsa)-miR-375 and the 3′ UTR of HuD mRNA (ELAVL4) was predicted by TargetScan, with the seed region nucleotides marked by white rectangles. (Bottom) Conservation among several species of the miR-375 sequence and the interaction site on the HuD 3′ UTR. (B) Forty-eight hours after transfection of the indicated cell lines (human and rodent) with either control (Ctrl) siRNA or miR-375 mimic, the levels of mature miR-375 were measured using RT-qPCR and normalized to U1 snRNA. The levels of HuD and loading control β-tubulin were assessed by Western blot analysis. The error bars indicate standard deviations. (C to E) BE(2)-M17 cells were infected with Lenti-GFP or Lenti-GFP-miR-375; 5 days later, green fluorescence was examined (C), the levels of miR-375 were assessed by RT-qPCR analysis (D), and the abundance of HuD protein was assessed by Western blot analysis (E).
FIG. 3.
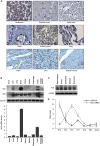
HuD expression in mouse and human tissues. (A) Immunohistochemical analysis of HuD expression in a human tissue array. (B) (Top) The levels of HuD, HuR, and loading control GAPDH in the mouse tissues indicated were assessed by Western blot analysis. (Bottom) The levels of HuD mRNA in the same tissues were assessed by RT-qPCR analysis and normalized to 18S rRNA. The error bars indicate standard deviations. (C) Levels of HuD in different mouse brain regions, as assessed by Western blot analysis. (D) miR-375 and HuD mRNA abundance in mouse telencephalon and cortex. RNA in the telencephalons of mice at the indicated developmental stages (cortex in adults) was used for quantification by RT-qPCR. miR-375 levels were normalized to U6, and HuD mRNA levels were normalized to 18S rRNA. The data are the means ± standard deviations from 3 mice.
FIG. 4.
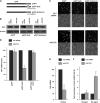
miR-375 targets the HuD 3′ UTR. (A) Schematic of plasmids pGFP, pGFP-HuD, and pGFP-HuD(mut), the last bearing 3 mutant nucleotides in the HuD site corresponding to the miR-375 seed region. (B and C) BE(2)-M17 cells were cotransfected with the plasmids shown in panel A and with either Ctrl siRNA or miR-375, as indicated; 48 h after transfection, GFP expression levels were assessed by Western blot analysis (B) and by green fluorescence (C). The data are representative of three independent experiments. (D) The levels of GFP, GFP-HuD, and GFP-HuD(mut) mRNAs in cells transfected as described in the legend to panel B were assessed by RT-qPCR analysis and normalized to 18S rRNA abundance. (E) By 48 h after transfection of Ctrl siRNA or miR-375, the levels of endogenous HuD mRNA were assessed by RT-qPCR analysis and normalized to 18S rRNA levels. (F) Forty-eight hours after transfection of Ctrl siRNA or miR-375, together with plasmids expressing tagged Argonaute proteins (pHA-Ago1 or pHA-Ago2), the levels of HuD mRNA associated with Argonaute proteins were assessed by IP using HA-coated beads, followed by HuD mRNA (and control UBC mRNA) detection using RT-qPCR. The data in panels D, E, and F are the means and standard errors of the mean (SEM) from three independent experiments.
FIG. 5.
miR-375 represses HuD mRNA stability and translation. (A) Twenty-four hours after transfection with either Ctrl siRNA or miR-375, BE(2)-M17 cells were treated with actinomycin D for the times indicated. RNA was then isolated; subjected to RT-qPCR analysis to measure the levels of HuD mRNA, GAPDH mRNA (encoding a housekeeping protein), and 18S rRNA (for normalization); and plotted on a semilogarithmic scale. mRNA half-lives were calculated as the times needed for each mRNA to reach one-half of its abundance at time zero. The error bars indicate standard deviations. (B) Lysates prepared from cells that were transfected as described in the legend to panel A were fractionated through sucrose gradients (top), and the relative distributions (percent) of HuD mRNA (left) and housekeeping GAPDH mRNA (right) were studied by RT-qPCR analysis of RNA in each of 10 gradient fractions. The arrows indicate the direction of sedimentation; fraction 1 had no ribosomal components. 40S and 60S, small and large ribosome subunits, respectively; 80S, monosome; LMW and HMW, low- and high-molecular-weight polysomes, respectively. The data are representative of 3 independent experiments.
FIG. 6.
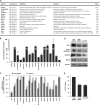
miR-375 recapitulates the effect of HuD silencing upon target mRNAs. (A) HuD target mRNAs were identified by RNP IP analysis of BE(2)-M17 cells using anti-HuD antibody (relative to IgG control IP); after isolation of RNA in the IP material, the mRNAs preferentially associated with HuD were identified by Illumina microarray analysis and studied using Ingenuity software (enrichments are shown in the Fold column). The top target transcripts encoding proteins with roles in neuronal signaling, division, cytoskeletal organization, and survival are listed. (B) The interaction of HuD with putative target transcripts in panel A was validated by RNP IP analysis of HuD, followed by RT-qPCR amplification using gene-specific primer pairs. Transcript abundance was normalized to 18S rRNA signals and plotted as fold enrichment of the mRNAs relative to their levels in IgG IP. (C) Forty-eight hours after silencing of HuD or overexpression of miR-375, the levels of HuD-associated mRNAs were measured by RT-qPCR analysis, normalized to 18S rRNA, and plotted as a percentage of the mRNA levels measured in the Ctrl siRNA transfection group. (D) Forty-eight hours after transfection with the small RNAs shown, the levels of HuD, PSD-95, KCNQ2, RhoA, and loading control β-actin were assessed by Western blot analysis. (E) Numbers of BE(2)-M17 cells by 48 h after transfection with the small RNAs shown. The data in panels B, C, and E represent the means and SEM from three independent experiments.
FIG. 7.
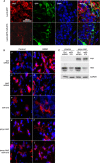
Consequences of overexpressing miR-375 and modulating HuD levels in vivo and in BDNF-treated cells. (A) Four weeks after infection of mouse hippocampus with Lenti-GFP or Lenti-GFP-miR-375, tissue sections (40 μm thick) were prepared. GFP expression was visualized by fluorescence and HuD abundance by immunofluorescence. (B) Forty-eight hours after transfection with the small RNAs and plasmids shown, BE(2)-M17 cells were treated with BDNF (10 ng/ml); 72 h later, the cytoskeleton was visualized using rhodamine-phalloidin (red) and the nuclei using DAPI (blue). (C) Western blot analysis of the expression of HuD, myc-tagged HuD (myc), and loading control GAPDH 48 h after transfection of BE(2)-M17 cells with pVector (pcDNA3) or pmyc-HuD, together with either Ctrl siRNA or miR-375.
Similar articles
- Emerging complexity of the HuD/ELAVl4 gene; implications for neuronal development, function, and dysfunction.
Bronicki LM, Jasmin BJ. Bronicki LM, et al. RNA. 2013 Aug;19(8):1019-37. doi: 10.1261/rna.039164.113. RNA. 2013. PMID: 23861535 Free PMC article. Review. - Degradation of high affinity HuD targets releases Kv1.1 mRNA from miR-129 repression by mTORC1.
Sosanya NM, Huang PP, Cacheaux LP, Chen CJ, Nguyen K, Perrone-Bizzozero NI, Raab-Graham KF. Sosanya NM, et al. J Cell Biol. 2013 Jul 8;202(1):53-69. doi: 10.1083/jcb.201212089. J Cell Biol. 2013. PMID: 23836929 Free PMC article. - RNA binding protein HuD and microRNA-203a cooperatively regulate insulinoma-associated 1 mRNA.
Kim C, Ahn S, Lee EK. Kim C, et al. Biochem Biophys Res Commun. 2020 Jan 22;521(4):971-976. doi: 10.1016/j.bbrc.2019.11.030. Epub 2019 Nov 10. Biochem Biophys Res Commun. 2020. PMID: 31722792 - Role of HuD in nervous system function and pathology.
Perrone-Bizzozero N, Bird CW. Perrone-Bizzozero N, et al. Front Biosci (Schol Ed). 2013 Jan 1;5(2):554-63. doi: 10.2741/s389. Front Biosci (Schol Ed). 2013. PMID: 23277068 Review.
Cited by
- Emerging complexity of the HuD/ELAVl4 gene; implications for neuronal development, function, and dysfunction.
Bronicki LM, Jasmin BJ. Bronicki LM, et al. RNA. 2013 Aug;19(8):1019-37. doi: 10.1261/rna.039164.113. RNA. 2013. PMID: 23861535 Free PMC article. Review. - Tumor suppressor miR-375 regulates MYC expression via repression of CIP2A coding sequence through multiple miRNA-mRNA interactions.
Jung HM, Patel RS, Phillips BL, Wang H, Cohen DM, Reinhold WC, Chang LJ, Yang LJ, Chan EK. Jung HM, et al. Mol Biol Cell. 2013 Jun;24(11):1638-48, S1-7. doi: 10.1091/mbc.E12-12-0891. Epub 2013 Apr 3. Mol Biol Cell. 2013. PMID: 23552692 Free PMC article. - RNA-Binding Protein HuD as a Versatile Factor in Neuronal and Non-Neuronal Systems.
Jung M, Lee EK. Jung M, et al. Biology (Basel). 2021 Apr 23;10(5):361. doi: 10.3390/biology10050361. Biology (Basel). 2021. PMID: 33922479 Free PMC article. Review. - Growth inhibition by miR-519 via multiple p21-inducing pathways.
Abdelmohsen K, Srikantan S, Tominaga K, Kang MJ, Yaniv Y, Martindale JL, Yang X, Park SS, Becker KG, Subramanian M, Maudsley S, Lal A, Gorospe M. Abdelmohsen K, et al. Mol Cell Biol. 2012 Jul;32(13):2530-48. doi: 10.1128/MCB.00510-12. Epub 2012 Apr 30. Mol Cell Biol. 2012. PMID: 22547681 Free PMC article. - Prenatal deletion of the RNA-binding protein HuD disrupts postnatal cortical circuit maturation and behavior.
DeBoer EM, Azevedo R, Vega TA, Brodkin J, Akamatsu W, Okano H, Wagner GC, Rasin MR. DeBoer EM, et al. J Neurosci. 2014 Mar 5;34(10):3674-86. doi: 10.1523/JNEUROSCI.3703-13.2014. J Neurosci. 2014. PMID: 24599466 Free PMC article.
References
Publication types
MeSH terms
Substances
LinkOut - more resources
Full Text Sources
Other Literature Sources
Molecular Biology Databases
Research Materials
Miscellaneous
