Quantitative proteomics of caveolin-1-regulated proteins: characterization of polymerase i and transcript release factor/CAVIN-1 IN endothelial cells - PubMed (original) (raw)
Quantitative proteomics of caveolin-1-regulated proteins: characterization of polymerase i and transcript release factor/CAVIN-1 IN endothelial cells
Alberto Dávalos et al. Mol Cell Proteomics. 2010 Oct.
Abstract
Caveolae are organelles abundant in the plasma membrane of many specialized cells including endothelial cells (ECs), epithelial cells, and adipocytes, and in these cells, caveolin-1 (Cav-1) is the major coat protein essential for the formation of caveolae. To identify proteins that require Cav-1 for stable incorporation into membrane raft domains, a quantitative proteomics analysis using isobaric tagging for relative and absolute quantification was performed on rafts isolated from wild-type and Cav-1-deficient mice. In three independent experiments, 117 proteins were consistently identified in membrane rafts with the largest differences in the levels of Cav-2 and in the caveola regulatory proteins Cavin-1 and Cavin-2. Because the lung is highly enriched in ECs, we validated and characterized the role of the newly described protein Cavin-1 in several cardiovascular tissues and in ECs. Cavin-1 was highly expressed in ECs lining blood vessels and in cultured ECs. Knockdown of Cavin-1 reduced the levels of Cav-1 and -2 and weakly influenced the formation of high molecular weight oligomers containing Cav-1 and -2. Cavin-1 silencing enhanced basal nitric oxide release from ECs but blocked proangiogenic phenotypes such as EC proliferation, migration, and morphogenesis in vitro. Thus, these data support an important role of Cavin-1 as a regulator of caveola function in ECs.
Figures
Fig. 1.
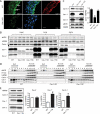
iTRAQ-based approach to quantitative analysis of lung proteins within caveolar membrane rafts. A, mouse lung membrane raft fractions from caveolin-1 KO and WT animals were isolated by solubilization by Triton X-100 at 4 °C, and after centrifugation, 12 sucrose gradient fractions were collected and analyzed by immunoblotting. Raft fractions 1 and 2 were labeled with iTRAQ reagents and analyzed by LC-MS/MS. B, number of proteins identified in lung DRMs of WT and Cav-1 KO mice. Three sets of experiments were performed each in duplicate, and common proteins were analyzed for quantitative differences. C, log2-transformed values of the normalized data from the ratio of WT/KO and the internal replicate illustrated for the means of the relative protein expression levels. D, Western blot confirmation of proteins levels reduced in raft fractions of Cav-1 KO mouse lung (fractions 1 and 2). Flotillin-1 (Flot-1) was used as raft protein marker. E, lung tissue lysate from Cav-1 KO animals of different ages were separated by SDS-PAGE and analyzed by immunoblotting for caveolins and Cavin levels.
Fig. 2.
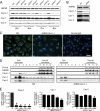
Cavin-1 levels are regulated by Cav-1 in endothelium. A, Cavin-1 is found in intact blood vessels. Representative immunofluorescence analysis of serial cross-sections (10 μm) from the mouse aorta stained for Cavin-1 (green), nuclei (DAPI; blue), and Cav-1 (red) in vessels from WT and Cav-1 KO mice is shown. The scale bar represents 100 μm. B, levels of eNOS, Hsp90 (loading control), caveolin-1 and -2, and Cavin-1 proteins in heart, lung, and aortic extracts from WT, Cav-1 KO, and Cav-1 RC mice. C, protein levels of Cavin-1 and caveolins in ECs isolated from WT, Cav-1 KO, and Cav-1 RC mice as quantified in the graph on right inset. D, Cavin-1 and caveolin localization to raft membrane fractions analyzed by sucrose gradient fractionation of ECs isolated from WT, Cav-1 KO, and Cav-1 RC mice. β-cop and HSP90 were used as markers for non-raft fractions. E, Cavin-1 and caveolin levels in ECs isolated from control (WT) and transgenic mice overexpressing Cav-1 (Cav-1 Tg) in the endothelium. Data are the mean ± S.E. of three independent experiments. *, p < 0.05 versus control (WT).
Fig. 3.
Characterization of Cavin-1 silencing in human ECs. Cavin-1 silencing in Eahy926 cells (A) and HUVECs (B). Cells were transfected with NS or with two independent siRNAs for Cavin-1 (siRNA-1 or siRNA-2), and at the indicated time points, protein levels were evaluated by immunoblotting. C, immunofluorescence microscopy of Cavin-1 (green) in Eahy926 cells in the absence or presence of Cavin-1 siRNA treatment. Blue reflects DAPI staining of nuclei, and the scale bar represent 25 μm. D, raft distribution of Cavin-1 and caveolins in control and Cavin-1-silenced Eahy926 cells. β-cop and HSP90 were used as markers for non-raft fractions. E, time course of mRNA expression of Cavin-1 and caveolins during Cavin-1 silencing. Gene expression data are expressed taking the control as reference (equal to 1). Values are the mean ± S.E. of three independent experiments. *, p < 0.05 (comparisons versus NS).
Fig. 4.
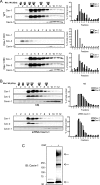
Oligomerization of caveolins and Cavin-1. The oligomerization state of caveolins and Cavin-1 was examined by velocity centrifugation gradients (calibrated with known molecular mass markers depicted by arrowheads) in extracts from WT (top panel), Cav-1 KO (middle panel), and Cav-1 RC (bottom panel) ECs. The graph on the right denotes the distribution of Cav-1 (white bars) and Cav-2 (black bars) in the gradient. B, Cavin-1 silencing weakly reduces high molecular mass caveolin oligomers in human ECs. C, in situ oligomerization of Cavin-1 by chemical cross-linking with DSP in intact cells. Arrows indicate Cavin-1-containing oligomers or protein complexes. IB, immunoblot.
Fig. 5.
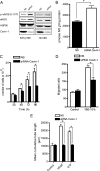
Cavin-1 regulates several endothelial cell phenotypes. A, Cavin-1 silencing (96 h) increases the levels and phosphorylation of eNOS at serine 1177 (p-eNOS-S-1177) in Eahy926 cells and HUVECs. Blots are representative of different experiments with similar results. HSP90 is used as a loading control. B, loss of Cavin-1 enhances basal nitric oxide release from Eahy926 cells. The total nitrite accumulation was quantified over 8 h. Data are the mean ± S.E. of three independent experiments performed in triplicate. *, p < 0.05 versus control (NS). Cavin-1 silencing reduces cell proliferation (C), migration (D), and tube formation (E) in ECs. Data are the mean ± S.E. of three independent experiments performed in quadruplicate (comparisons versus control (NS) at each time point). *, p < 0.05 versus control (NS). S1P, sphingosine 1-phosphate.
Similar articles
- IGF-IR internalizes with Caveolin-1 and PTRF/Cavin in HaCat cells.
Salani B, Passalacqua M, Maffioli S, Briatore L, Hamoudane M, Contini P, Cordera R, Maggi D. Salani B, et al. PLoS One. 2010 Nov 30;5(11):e14157. doi: 10.1371/journal.pone.0014157. PLoS One. 2010. PMID: 21152401 Free PMC article. - PTRF-Cavin, a conserved cytoplasmic protein required for caveola formation and function.
Hill MM, Bastiani M, Luetterforst R, Kirkham M, Kirkham A, Nixon SJ, Walser P, Abankwa D, Oorschot VM, Martin S, Hancock JF, Parton RG. Hill MM, et al. Cell. 2008 Jan 11;132(1):113-24. doi: 10.1016/j.cell.2007.11.042. Cell. 2008. PMID: 18191225 Free PMC article. - Cavin-1 and Caveolin-1 are both required to support cell proliferation, migration and anchorage-independent cell growth in rhabdomyosarcoma.
Faggi F, Chiarelli N, Colombi M, Mitola S, Ronca R, Madaro L, Bouche M, Poliani PL, Vezzoli M, Longhena F, Monti E, Salani B, Maggi D, Keller C, Fanzani A. Faggi F, et al. Lab Invest. 2015 Jun;95(6):585-602. doi: 10.1038/labinvest.2015.45. Epub 2015 Mar 30. Lab Invest. 2015. PMID: 25822667 - The role of caveolin-1 in cardiovascular regulation.
Rahman A, Swärd K. Rahman A, et al. Acta Physiol (Oxf). 2009 Feb;195(2):231-45. doi: 10.1111/j.1748-1716.2008.01907.x. Epub 2008 Sep 25. Acta Physiol (Oxf). 2009. PMID: 18826501 Review. - Role of Caveolae family-related proteins in the development of breast cancer.
Han Q, Qiu S, Hu H, Li W, Li X. Han Q, et al. Front Mol Biosci. 2023 Sep 27;10:1242426. doi: 10.3389/fmolb.2023.1242426. eCollection 2023. Front Mol Biosci. 2023. PMID: 37828916 Free PMC article. Review.
Cited by
- Lessons from cavin-1 deficiency.
Liu L. Liu L. Biochem Soc Trans. 2020 Feb 28;48(1):147-154. doi: 10.1042/BST20190380. Biochem Soc Trans. 2020. PMID: 31922193 Free PMC article. Review. - Deformation of caveolae impacts global transcription and translation processes through relocalization of cavin-1.
Qifti A, Balaji S, Scarlata S. Qifti A, et al. J Biol Chem. 2022 Jun;298(6):102005. doi: 10.1016/j.jbc.2022.102005. Epub 2022 May 2. J Biol Chem. 2022. PMID: 35513070 Free PMC article. - Elevated pulmonary arterial pressure and altered expression of Ddah1 and Arg1 in mice lacking cavin-1/PTRF.
Swärd K, Sadegh MK, Mori M, Erjefält JS, Rippe C. Swärd K, et al. Physiol Rep. 2013 Jun;1(1):e00008. doi: 10.1002/PHY2.8. Epub 2013 Jun 7. Physiol Rep. 2013. PMID: 24303100 Free PMC article. - Endothelial Notch signaling controls insulin transport in muscle.
Hasan SS, Jabs M, Taylor J, Wiedmann L, Leibing T, Nordström V, Federico G, Roma LP, Carlein C, Wolff G, Ekim-Üstünel B, Brune M, Moll I, Tetzlaff F, Gröne HJ, Fleming T, Géraud C, Herzig S, Nawroth PP, Fischer A. Hasan SS, et al. EMBO Mol Med. 2020 Apr 7;12(4):e09271. doi: 10.15252/emmm.201809271. Epub 2020 Mar 18. EMBO Mol Med. 2020. PMID: 32187826 Free PMC article. - CAV1-CAVIN1-LC3B-mediated autophagy regulates high glucose-stimulated LDL transcytosis.
Bai X, Yang X, Jia X, Rong Y, Chen L, Zeng T, Deng X, Li W, Wu G, Wang L, Li Y, Zhang J, Xiong Z, Xiong L, Wang Y, Zhu L, Zhao Y, Jin S. Bai X, et al. Autophagy. 2020 Jun;16(6):1111-1129. doi: 10.1080/15548627.2019.1659613. Epub 2019 Sep 4. Autophagy. 2020. PMID: 31448673 Free PMC article.
References
- Parton R. G., Simons K. (2007) The multiple faces of caveolae. Nat. Rev. Mol. Cell Biol. 8, 185–194 - PubMed
- Pilch P. F., Souto R. P., Liu L., Jedrychowski M. P., Berg E. A., Costello C. E., Gygi S. P. (2007) Cellular spelunking: exploring adipocyte caveolae. J. Lipid Res. 48, 2103–2111 - PubMed
- Gratton J. P., Bernatchez P., Sessa W. C. (2004) Caveolae and caveolins in the cardiovascular system. Circ. Res. 94, 1408–1417 - PubMed
- Cohen A. W., Hnasko R., Schubert W., Lisanti M. P. (2004) Role of caveolae and caveolins in health and disease. Physiol. Rev. 84, 1341–1379 - PubMed
Publication types
MeSH terms
Substances
Grants and funding
- R01 HL61371/HL/NHLBI NIH HHS/United States
- R01 HL64793/HL/NHLBI NIH HHS/United States
- R01 HL064793/HL/NHLBI NIH HHS/United States
- N01-HV-28186/HV/NHLBI NIH HHS/United States
- R37 HL061371/HL/NHLBI NIH HHS/United States
- P01 HL70295/HL/NHLBI NIH HHS/United States
- R01 HL061371/HL/NHLBI NIH HHS/United States
- P01 HL070295/HL/NHLBI NIH HHS/United States
- R01 HL081860/HL/NHLBI NIH HHS/United States
- N01HV28186/HV/NHLBI NIH HHS/United States
- R01 HL081190/HL/NHLBI NIH HHS/United States
LinkOut - more resources
Full Text Sources
Other Literature Sources
Miscellaneous


