Web-based, participant-driven studies yield novel genetic associations for common traits - PubMed (original) (raw)
Web-based, participant-driven studies yield novel genetic associations for common traits
Nicholas Eriksson et al. PLoS Genet. 2010.
Abstract
Despite the recent rapid growth in genome-wide data, much of human variation remains entirely unexplained. A significant challenge in the pursuit of the genetic basis for variation in common human traits is the efficient, coordinated collection of genotype and phenotype data. We have developed a novel research framework that facilitates the parallel study of a wide assortment of traits within a single cohort. The approach takes advantage of the interactivity of the Web both to gather data and to present genetic information to research participants, while taking care to correct for the population structure inherent to this study design. Here we report initial results from a participant-driven study of 22 traits. Replications of associations (in the genes OCA2, HERC2, SLC45A2, SLC24A4, IRF4, TYR, TYRP1, ASIP, and MC1R) for hair color, eye color, and freckling validate the Web-based, self-reporting paradigm. The identification of novel associations for hair morphology (rs17646946, near TCHH; rs7349332, near WNT10A; and rs1556547, near OFCC1), freckling (rs2153271, in BNC2), the ability to smell the methanethiol produced after eating asparagus (rs4481887, near OR2M7), and photic sneeze reflex (rs10427255, near ZEB2, and rs11856995, near NR2F2) illustrates the power of the approach.
Conflict of interest statement
NE, JMM, JYT, LSH, BN, SS, LA, AW, and JM are or have been employed by 23andMe and own stock options in the company. 23andMe co-president AW has provided general guidance, including guidance related to the company's research undertakings and direction. PLoS Genetics' Editor-in-Chief Gregory S. Barsh is a potential consultant to 23andMe and therefore recused himself from the editorial and peer-review process. PLoS co-founder Michael B. Eisen is a member of the 23andMe Scientific Advisory Board.
Figures
Figure 1. Web-based accrual of genotype and phenotype data via a personal genetic information service.
(A) Individual participant signs up for service via web; (B) Participant receives sample collection kit; (C) Participant consents, via web, to use of anonymized genotype and survey responses for research; (D) Participant sends saliva sample to contracted lab; (E) Participant logs on to service web site with option to respond to one or more surveys, prior to having access to personal genetic data; (F) Laboratory processes sample, generating data for  single nucleotide polymorphisms (SNPs); (G) Encrypted genotype data transferred from laboratory to secure server; (H) Participant logs on to service web site with option to access personal genetic data (both raw genotypes and customized reports); (I) Participant logs on and has the option to respond to one or more surveys; (J) New genetic reports posted, new surveys posted; (K) Genotype data and survey responses for individuals, coded and stripped of individually identifying information, are transferred to research team. Shaded boxes indicate participant actions; clear boxes indicate lab or service actions. Dashed boxes indicate optional participant actions within framework of service access.
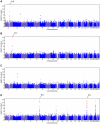
Figure 2. Manhattan plots for new associations.
Shown are (A) hair curl, (B) asparagus anosmia, (C) photic sneeze reflex, and (D) freckling. Plots show scores ( p-values) for all SNPs by physical position. All plots are trimmed at a maximum score of 15. For regions with a more significant association, the strongest score in that region is shown above the region.
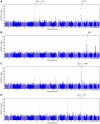
Figure 3. Manhattan plots for replications.
Shown are (A) hair color, (B) red hair, (C) blue to brown eye color, and (D) green versus blue eye color. Plots show scores ( p-values) for all SNPs by physical position. All plots are trimmed at a maximum score of 15. For regions with a more significant association, the strongest score in that region is shown above the region.
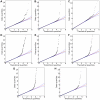
Figure 4. Quantile-quantile plots for new associations and replications.
Shown are (A) hair curl, (B) asparagus anosmia, (C) photic sneeze reflex, (D) freckling, (E) hair color, (F) red hair, (G) blue to brown eye color, and (H) green versus blue eye color. All plots are trimmed at a maximum score of 15 to better show details. Approximate 95% CIs are indicated in blue. The red line passes through the median p-value.
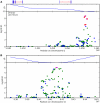
Figure 5. Bayes factors for genotyped and imputed SNPs for hair curl around TCHH.
Plotted are  Bayes factors for all SNPs in HapMap in the region. Red/blue circles represent typed SNPs, magenta/green squares imputed SNPs; Red/magenta points have log Bayes factors over 6. Genes are marked in the top track with gene names inside the figure. Linkage disequilibrium (relative to the SNP with the largest Bayes factor) is plotted in the middle track.
Figure 6. Bayes factors for genotyped and imputed SNPs for hair curl around WNT10A.
For details, see Figure 5.
Figure 7. Bayes factors for genotyped and imputed SNPs for hair curl around OFCC1.
For details, see Figure 5.
Figure 8. Bayes factors for genotyped and imputed SNPs for asparagus anosmia around OR2M7.
For details, see Figure 5.
Figure 9. Bayes factors for genotyped and imputed SNPs for two photic sneeze associations.
Regions shown are (A) near ZFHX1B/ZEB2 on 2q22.3 and (B) near NR2F2 on 15q26.2. For details, see Figure 5.
Figure 10. Bayes factors for genotyped and imputed SNPs for freckling around BNC2.
For details, see Figure 5.
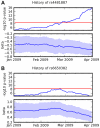
Figure 11. Association over time for two SNPs and two traits.
(A) Association between rs4481887 and asparagus anosmia, steadily increasing in certainty. (B) Association between rs6650382 and photic sneeze: a very promising initial result, but  , the log odds ratio, regressed towards 0. Both traits were assessed in the same survey, so they had approximately the same number of responses at all points in time. Scores (
 p-values) and regression coefficients are plotted using the genotype and phenotype data that was available at various points in time. The red line indicates our significance threshold of 8.4.
Comment in
- Consent and internet-enabled human genomics.
Gibson G, Copenhaver GP. Gibson G, et al. PLoS Genet. 2010 Jun 24;6(6):e1000965. doi: 10.1371/journal.pgen.1000965. PLoS Genet. 2010. PMID: 20585615 Free PMC article. No abstract available.
Similar articles
- Haplotype function score improves biological interpretation and cross-ancestry polygenic prediction of human complex traits.
Song W, Shi Y, Lin GN. Song W, et al. Elife. 2024 Apr 19;12:RP92574. doi: 10.7554/eLife.92574. Elife. 2024. PMID: 38639992 Free PMC article. - High-throughput phenotype-to-genotype testing of meningococcal carriage and disease isolates detects genetic determinants of disease-relevant phenotypic traits.
Farzand R, Kimani MW, Mourkas E, Jama A, Clark JL, De Ste Croix M, Monteith WM, Lucidarme J, Oldfield NJ, Turner DPJ, Borrow R, Martinez-Pomares L, Sheppard SK, Bayliss CD. Farzand R, et al. mBio. 2024 Dec 11;15(12):e0305924. doi: 10.1128/mbio.03059-24. Epub 2024 Oct 30. mBio. 2024. PMID: 39475240 Free PMC article. - A comprehensive study of common and rare genetic variants in spermatogenesis-related loci identifies new risk factors for idiopathic severe spermatogenic failure.
Guzmán-Jiménez A, González-Muñoz S, Cerván-Martín M, Garrido N, Castilla JA, Gonzalvo MC, Clavero A, Molina M, Luján S, Santos-Ribeiro S, Vilches MÁ, Espuch A, Maldonado V, Galiano-Gutiérrez N, Santamaría-López E, González-Ravina C, Quintana-Ferraz F, Gómez S, Amorós D, Martínez-Granados L, Ortega-González Y, Burgos M, Pereira-Caetano I, Bulbul O, Castellano S, Romano M, Albani E, Bassas L, Seixas S, Gonçalves J, Lopes AM, Larriba S, Palomino-Morales RJ, Carmona FD, Bossini-Castillo L. Guzmán-Jiménez A, et al. Hum Reprod Open. 2024 Nov 13;2024(4):hoae069. doi: 10.1093/hropen/hoae069. eCollection 2024. Hum Reprod Open. 2024. PMID: 39678461 Free PMC article. - Depressing time: Waiting, melancholia, and the psychoanalytic practice of care.
Salisbury L, Baraitser L. Salisbury L, et al. In: Kirtsoglou E, Simpson B, editors. The Time of Anthropology: Studies of Contemporary Chronopolitics. Abingdon: Routledge; 2020. Chapter 5. In: Kirtsoglou E, Simpson B, editors. The Time of Anthropology: Studies of Contemporary Chronopolitics. Abingdon: Routledge; 2020. Chapter 5. PMID: 36137063 Free Books & Documents. Review. - Antibody tests for identification of current and past infection with SARS-CoV-2.
Fox T, Geppert J, Dinnes J, Scandrett K, Bigio J, Sulis G, Hettiarachchi D, Mathangasinghe Y, Weeratunga P, Wickramasinghe D, Bergman H, Buckley BS, Probyn K, Sguassero Y, Davenport C, Cunningham J, Dittrich S, Emperador D, Hooft L, Leeflang MM, McInnes MD, Spijker R, Struyf T, Van den Bruel A, Verbakel JY, Takwoingi Y, Taylor-Phillips S, Deeks JJ; Cochrane COVID-19 Diagnostic Test Accuracy Group. Fox T, et al. Cochrane Database Syst Rev. 2022 Nov 17;11(11):CD013652. doi: 10.1002/14651858.CD013652.pub2. Cochrane Database Syst Rev. 2022. PMID: 36394900 Free PMC article. Review.
Cited by
- Escape from crossover interference increases with maternal age.
Campbell CL, Furlotte NA, Eriksson N, Hinds D, Auton A. Campbell CL, et al. Nat Commun. 2015 Feb 19;6:6260. doi: 10.1038/ncomms7260. Nat Commun. 2015. PMID: 25695863 Free PMC article. - Validation of Candidate Sleep Disorder Risk Genes Using Zebrafish.
Tran S, Prober DA. Tran S, et al. Front Mol Neurosci. 2022 Apr 7;15:873520. doi: 10.3389/fnmol.2022.873520. eCollection 2022. Front Mol Neurosci. 2022. PMID: 35465097 Free PMC article. Review. - A framework for integrating microbial dispersal modes into soil ecosystem ecology.
Choudoir MJ, DeAngelis KM. Choudoir MJ, et al. iScience. 2022 Feb 10;25(3):103887. doi: 10.1016/j.isci.2022.103887. eCollection 2022 Mar 18. iScience. 2022. PMID: 35243247 Free PMC article. Review. - Consent and internet-enabled human genomics.
Gibson G, Copenhaver GP. Gibson G, et al. PLoS Genet. 2010 Jun 24;6(6):e1000965. doi: 10.1371/journal.pgen.1000965. PLoS Genet. 2010. PMID: 20585615 Free PMC article. No abstract available. - Consumer genomics will change your life, whether you get tested or not.
Khan R, Mittelman D. Khan R, et al. Genome Biol. 2018 Aug 20;19(1):120. doi: 10.1186/s13059-018-1506-1. Genome Biol. 2018. PMID: 30124172 Free PMC article.
References
- Cavalli-Sforza L, Bodmer W. The Genetics of Human Populations. Freeman Company 1971
- Valverde P, Healy E, Jackson I, Rees JL, Thody AJ. Variants of the melanocyte-stimulating hormone receptor gene are associated with red hair and fair skin in humans. Nat Genet. 1995;11:328–330. - PubMed
- Sulem P, Gudbjartsson DF, Stacey SN, Helgason A, Rafnar T, et al. Genetic determinants of hair, eye and skin pigmentation in europeans. Nat Genet. 2007;39:1443–1452. - PubMed
- Han J, Kraft P, Nan H, Guo Q, Chen C, et al. A genome-wide association study identifies novel alleles associated with hair color and skin pigmentation. PLoS Genet. 2008;4:e1000074. doi: 10.1371/journal.pgen.1000074. - DOI - PMC - PubMed
Publication types
MeSH terms
LinkOut - more resources
Full Text Sources
Other Literature Sources
Molecular Biology Databases
Research Materials

