Variations in stromal signatures in breast and colorectal cancer metastases - PubMed (original) (raw)
Variations in stromal signatures in breast and colorectal cancer metastases
Jonathan A Webster et al. J Pathol. 2010 Oct.
Abstract
The tumour microenvironment (TME) plays an important role in tumour survival and growth, but little is known about the degree of preservation between different stromal response patterns found in primary tumours and their metastases. We have previously identified gene expression profiles for two distinct stromal signatures in breast carcinoma of fibroblast (aka DTF) and macrophage (aka CSF1) response and found them to be correlated with clinicopathological features, including outcome. In this study, we compare the DTF fibroblast and CSF1 macrophage stromal response patterns in primary breast and colorectal cancers to their matched lymph node metastases. In both breast and colorectal cancer, there was a significant positive correlation between the CSF1 macrophage signature in the primary tumours and the matched lymph node metastases, as assessed by immunohistochemical markers. No such correlation was observed for the DTF fibroblast signature. A similar result was seen in independent analysis of two published gene expression microarray datasets. The variations of these stromal reaction patterns from the primary to the metastasis shed light on the relationship between the neoplastic cells and the non-neoplastic cells in the TME. The preservation of the CSF1 macrophage response pattern in metastases lends support to targeting the CSF1 pathway in cancer.
Copyright 2010 Pathological Society of Great Britain and Ireland. Published by John Wiley & Sons, Ltd.
Conflict of interest statement
Conflict of interest statement: The authors and the study sponsors have no conflict of interest in this work.
Figures
Figure 1
Representative images of the immunohistochemistry for selective markers. A) CTSL in a primary invasive ductal carcinoma of the breast. B) CTSL in a breast metastasis. C) CSPG2 in a primary invasive ductal carcinoma of the breast. D) CSPG2 in a breast metastasis. E) CD163 in a primary colonic adenocarcinoma. F) CD163 in a colonic adenocarcinoma metastasis. G) CD163 in a breast metastasis. H) SPARC in a primary colonic adenocarcinoma. I) SPARC in a colonic adenocarcinoma metastasis. J) SPARC in a breast metastasis.
Figure 2
Analysis of CSF1 macrophage response signature in 49 matched primary and regional lymph node metastatic breast cancer as measured by 4 immunohistochemical markers and displayed as a scatter plot of average marker score for each primary and regional lymph node metastatic breast cancer pair.
Figure 3
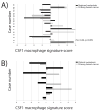
A) Gene expression profiling of 15 matched primary and regional lymph node metastatic breast cancers with the CSF1 macrophage response signature core gene set. The bar graph shows the sums of CSF1 macrophage response signature core for each matched pair, blue represents the primary and red represents the metastasis. B) Gene expression profiling of 8 matched primary and distant metastatic breast cancers. The bar graph shows the sums of CSF1 macrophage response signature core for each matched pair.
Figure 4
Results from the of CSF1 macrophage response signature in matched primary and metastatic colorectal cancer as a scatter plot of average marker score for each primary and regional lymph node metastatic breast cancer pair.
Figure 5
Analysis of DTF fibroblast stromal signature in matched primary and regional lymph node metastatic breast cancer for 5 DTF fibroblast response signature markers for a set of 49 primary and regional lymph node metastatic breast cancer pairings as a scatter plot of average marker score for each primary and regional lymph node metastatic breast cancer pair.
Figure 6
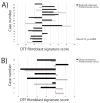
A) Gene expression profiling of 15 matched primary and regional lymph node metastatic breast cancers with the DTF fibroblast response signature core gene set. The bar graph shows the sums of DTF fibroblast response signature core for each matched pair, blue represents the primary and red represents the metastasis. B) Gene expression profiling of 8 matched primary and distant metastatic breast cancers. The bar graph shows the sums of DTF fibroblast response signature core for each matched pair.
Similar articles
- Endogenous versus tumor-specific host response to breast carcinoma: a study of stromal response in synchronous breast primaries and biopsy site changes.
Wu JM, Beck AH, Pate LL, Witten D, Zhu SX, Montgomery KD, Allison KH, van de Rijn M, West RB. Wu JM, et al. Clin Cancer Res. 2011 Feb 1;17(3):437-46. doi: 10.1158/1078-0432.CCR-10-1709. Epub 2010 Nov 22. Clin Cancer Res. 2011. PMID: 21098336 Free PMC article. - Stromal signatures in endometrioid endometrial carcinomas.
Espinosa I, Catasus L, D' Angelo E, Mozos A, Pedrola N, Bértolo C, Ferrer I, Zannoni GF, West RB, van de Rijn M, Matias-Guiu X, Prat J. Espinosa I, et al. Mod Pathol. 2014 Apr;27(4):631-9. doi: 10.1038/modpathol.2013.131. Epub 2013 Nov 22. Mod Pathol. 2014. PMID: 24263966 - Stromal responses among common carcinomas correlated with clinicopathologic features.
Chen JL, Espinosa I, Lin AY, Liao OY, van de Rijn M, West RB. Chen JL, et al. Clin Cancer Res. 2013 Sep 15;19(18):5127-35. doi: 10.1158/1078-0432.CCR-12-3127. Epub 2013 Jun 26. Clin Cancer Res. 2013. PMID: 23804424 Free PMC article. - Next generation sequencing-based expression profiling identifies signatures from benign stromal proliferations that define stromal components of breast cancer.
Guo X, Zhu SX, Brunner AL, van de Rijn M, West RB. Guo X, et al. Breast Cancer Res. 2013 Dec 17;15(6):R117. doi: 10.1186/bcr3586. Breast Cancer Res. 2013. PMID: 24342436 Free PMC article. - Macrophage-colony stimulating factor (CSF1) predicts breast cancer progression and mortality.
Richardsen E, Uglehus RD, Johnsen SH, Busund LT. Richardsen E, et al. Anticancer Res. 2015 Feb;35(2):865-74. Anticancer Res. 2015. PMID: 25667468
Cited by
- Detection of long non-coding RNA in archival tissue: correlation with polycomb protein expression in primary and metastatic breast carcinoma.
Chisholm KM, Wan Y, Li R, Montgomery KD, Chang HY, West RB. Chisholm KM, et al. PLoS One. 2012;7(10):e47998. doi: 10.1371/journal.pone.0047998. Epub 2012 Oct 25. PLoS One. 2012. PMID: 23133536 Free PMC article. - Listeria-based hepatocellular carcinoma vaccine facilitates anti-PD-1 therapy by regulating macrophage polarization.
Xu G, Feng D, Yao Y, Li P, Sun H, Yang H, Li C, Jiang R, Sun B, Chen Y. Xu G, et al. Oncogene. 2020 Feb;39(7):1429-1444. doi: 10.1038/s41388-019-1072-3. Epub 2019 Oct 28. Oncogene. 2020. PMID: 31659256 - Markers of fibroblast-rich tumor stroma and perivascular cells in serous ovarian cancer: Inter- and intra-patient heterogeneity and impact on survival.
Corvigno S, Wisman GB, Mezheyeuski A, van der Zee AG, Nijman HW, Åvall-Lundqvist E, Östman A, Dahlstrand H. Corvigno S, et al. Oncotarget. 2016 Apr 5;7(14):18573-84. doi: 10.18632/oncotarget.7613. Oncotarget. 2016. PMID: 26918345 Free PMC article. - Endogenous versus tumor-specific host response to breast carcinoma: a study of stromal response in synchronous breast primaries and biopsy site changes.
Wu JM, Beck AH, Pate LL, Witten D, Zhu SX, Montgomery KD, Allison KH, van de Rijn M, West RB. Wu JM, et al. Clin Cancer Res. 2011 Feb 1;17(3):437-46. doi: 10.1158/1078-0432.CCR-10-1709. Epub 2010 Nov 22. Clin Cancer Res. 2011. PMID: 21098336 Free PMC article. - (Cyto)genomic and epigenetic characterization of BICR 10 cell line and three new established primary human head and neck squamous cell carcinoma cultures.
Ribeiro IP, Rodrigues JM, Mascarenhas A, Marques V, Caramelo F, Julião MJ, Liehr T, Melo JB, Carreira IM. Ribeiro IP, et al. Genes Genomics. 2019 Oct;41(10):1207-1221. doi: 10.1007/s13258-019-00850-6. Epub 2019 Jul 18. Genes Genomics. 2019. PMID: 31321735
References
- Mueller MM, Fusenig NE. Friends or foes Bipolar effects of the tumour stroma in cancer. Nat Rev Cancer. 2004;4:839–49. - PubMed
- Orimo A, Gupta PB, Sgroi DC, et al. Stromal fibroblasts present in invasive human breast carcinomas promote tumor growth and angiogenesis through elevated SDF-1/CXCL12 secretion. Cell. 2005;121 :335–48. - PubMed
Publication types
MeSH terms
Substances
LinkOut - more resources
Full Text Sources
Medical
Research Materials
Miscellaneous


