Three-dimensional collagen represses cyclin E1 via β1 integrin in invasive breast cancer cells - PubMed (original) (raw)
Three-dimensional collagen represses cyclin E1 via β1 integrin in invasive breast cancer cells
Yuehan Wu et al. Breast Cancer Res Treat. 2011 Jun.
Abstract
The behavior of breast epithelial cells is influenced by their microenvironment which includes stromal cells and extracellular matrix (ECM). During cancer progression, the tissue microenvironment fails to control proliferation and differentiation, resulting in uncontrolled growth and invasion. Upon invasion, the ECM encountered by breast cancer cells changes from primarily laminin and collagen IV to primarily collagen I. We show here that culturing invasive breast cancer cells in 3-dimensional (3D) collagen I inhibits proliferation through direct regulation of cyclin E1, a G(1)/S regulator that is overexpressed in breast cancer. When the breast cancer cell line MDA-MB-231 was cultured within 3D collagen I gels, the G(1)/S transition was inhibited as compared to cells cultured on conventional 2D collagen or plastic dishes. Cells in 3D collagen downregulated cyclin E1 protein and mRNA, with no change in cyclin D1 level. Cyclin D1 was primarily cytoplasmic in 3D cultures, and this was accompanied by decreased phosphorylation of Rb, a nuclear target for both cyclin E1- and cyclin D1-associated kinases. Positive regulators of cyclin E1 expression, the transcription factor c-Myc and cold-inducible RNA binding protein (CIRP), were decreased in 3D collagen cultures, while the collagen I receptor β1 integrin was greatly increased. Inhibition of β1 integrin function rescued proliferation and cyclin E1 expression as well as c-Myc expression and Rb phosphorylation, but cyclin D1 remained cytoplasmic. We conclude that cyclin E1 is repressed independent of effects on cyclin D1 in a 3D collagen environment and dependent on β1 integrin interaction with collagen I, reducing proliferation of invasive breast cancer cells.
Figures
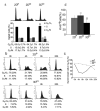
Fig. 1
3D collagen culture inhibits cell cycle progression. a Cell cycle analysis of asynchronous MDA-MB-231 cells in 2DP, 2DCI, or 3DCI. Cell cycle phase distribution was obtained and percentage of gated cells in each phase were expressed as mean ± SD and assessed by Student’s t test; **p < 0.01 vs. 2DP, ΔΔp < 0.01 vs. 2DCI. b Cell cycle analysis of synchronized MDA-MB-231 cells on 2DP or in 3DCI. Data is representative of 2 experiments. c Percentage of synchronized cells in G0/G1 from B was plotted for the indicated time points. d Quantitative analysis of proliferation in asynchronous cells. Percentage of Ki-67+ cells was calculated by counting at least 10 40X fields (at least 300 cells) per condition. **p < 0.01 vs. 2DP, ΔΔp < 0.01 vs. 2DCI
Fig. 2
3D collagen culture downregulates cyclin E1 without changing cyclin D1. a Western blot of cyclin E1 in 2DP, 2DCI and 3DCI MDA-MB-231 cells and 2DP MCF-10A cells. β-actin was used as a loading control. Representative of 2 experiments. b Western blots of cyclin E1 and cyclin D1 in 2DP, 2DCI and 3DCI MDA-MB-231 cells. The relative quantity of cyclin E1 and cyclin D1 was calculated after normalization to actin (d) , expressed as mean ± SD and assessed by Student’s t test. Δp < 0.05 vs. 2DCI , **p < 0.01 vs. 2DP. c Cyclin E1 mRNA level was determined by real-time RT-PCR. Threshold cycles (_C_t values) were normalized to GAPDH or 18s rRNA and plotted as relative mRNA levels. Values were expressed as mean ± SD and assessed by Student’s t test. **p < 0.01 vs. 2DP, ΔΔp < 0.01 vs. 2DCI
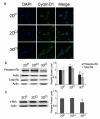
Fig. 3
Cyclin D1 relocalized from the nucleus to the cytoplasm in 3D collagen culture. a Confocal images of cyclin D1 in MDA-MB-231 cells. Cyclin D1 staining was visualized with Alexa Fluor 488 conjugated secondary antibody (green). Nuclei were stained with DAPI (blue). Magnification 63X. b Western blots of phospho-Rb (Ser780) and Rb in 2DP, 2DCI and 3DCI MDA-MB-231 cells. *p < 0.05 vs. 2DP, ΔΔp < 0.01 vs. 2DCI. c Western blot of c-Myc in 2DP, 2DCI and 3DCI of MDA-MB-231 cells. *p < 0.05 vs. 2DP, ΔΔp < 0.01 vs. 2DCI. The relative quantity of phospho-Rb, total Rb or c-Myc protein was calculated as in Fig. 2b
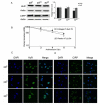
Fig. 4
CIRP was decreased and relocalized to the cytoplasm in 3D collagen culture. a Western blots for HuR and CIRP in 2DP, 2DCI and 3DCI MDA-MB-231 cells. ** p < 0.01 vs. 2DP. The relative quantity of HuR and CIRP proteins was calculated as in Fig. 2b. b Half-life determination for cyclin E1 mRNA. Total RNA was extracted from cells grown on 2DP or in 3DCI at the indicated time after addition of actinomycin D. Real time RT-PCR was used to analyze cyclin E1 mRNA level. Data were normalized to GAPDH mRNA or 18s rRNA and plotted on a semi-logarithmic scale. c,d Confocal images of HuR and CIRP localization. HuR or CIRP staining was visualized with Alexa Fluor 488 conjugated secondary antibody (green). Nuclei were stained with DAPI (blue). Magnification 63X
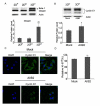
Fig. 5
β1 integrin was dramatically increased by 3D collagen culture. a Western blot for β1 integrin in 2DP, 2DCI and 3DCI MDA-MB-231 cells. **p < 0.01 vs. 2DP, ΔΔp < 0.01 vs. 2DCI. The relative quantity of β1 integrin protein (both bands) was calculated after normalization to actin, expressed as mean ± SD and assessed by Student’s t test. b Western blot for cyclin E1 in 3DCI cultures of MDA-MB-231 cells with (AIIB2) or without AIIB2 (mock) antibody. *p < 0.05. c Confocal images of cyclin D1 in 3DCI MDA-MB-231 cells with or without AIIB2 treatment (63X magnification). d Quantitation of Ki-67 in 3DCI MDA-MB-231 cells with or without AIIB2 treatment. Percentage of Ki-67+ cells was calculated by counting at least 10 microscope fields at 40X (at least 600 cells) for each condition. **p < 0.01
Fig. 6
β1 integrin inhibition increased Rb and its phosphorylation as well as c-Myc in 3D collagen. a Western blots of phospho-Rb and total Rb in 3DCI cultures of MDA-MB-231 cells with (AIIB2) or without (Mock) β1 integrin antibody. Cells were grown in 3DCI for 24h and then treated with AIIB2 or IgG1 for 2h. *p < 0.05. b Western blot of c-Myc in 3DCI cultures of MDA-MB-231 cells with or without AIIB2 antibody. *p < 0.05. The relative quantity of phospho-Rb, total Rb or c-Myc was calculated as in Fig. 2b
Similar articles
- Estrogen regulation of cyclin E2 requires cyclin D1 but not c-Myc.
Caldon CE, Sergio CM, Schütte J, Boersma MN, Sutherland RL, Carroll JS, Musgrove EA. Caldon CE, et al. Mol Cell Biol. 2009 Sep;29(17):4623-39. doi: 10.1128/MCB.00269-09. Epub 2009 Jun 29. Mol Cell Biol. 2009. PMID: 19564413 Free PMC article. - Cold-inducible RNA-binding protein contributes to human antigen R and cyclin E1 deregulation in breast cancer.
Guo X, Wu Y, Hartley RS. Guo X, et al. Mol Carcinog. 2010 Feb;49(2):130-40. doi: 10.1002/mc.20582. Mol Carcinog. 2010. PMID: 19777567 Free PMC article. - Staged stromal extracellular 3D matrices differentially regulate breast cancer cell responses through PI3K and beta1-integrins.
Castelló-Cros R, Khan DR, Simons J, Valianou M, Cukierman E. Castelló-Cros R, et al. BMC Cancer. 2009 Mar 26;9:94. doi: 10.1186/1471-2407-9-94. BMC Cancer. 2009. PMID: 19323811 Free PMC article. - GSK3β-dependent cyclin D1 and cyclin E1 degradation is indispensable for NVP-BEZ235 induced G0/G1 arrest in neuroblastoma cells.
Liu SL, Liu Z, Zhang LD, Zhu HQ, Guo JH, Zhao M, Wu YL, Liu F, Gao FH. Liu SL, et al. Cell Cycle. 2017;16(24):2386-2395. doi: 10.1080/15384101.2017.1383577. Epub 2017 Nov 14. Cell Cycle. 2017. PMID: 28980866 Free PMC article. - Estrogen and antiestrogen regulation of cell cycle progression in breast cancer cells.
Doisneau-Sixou SF, Sergio CM, Carroll JS, Hui R, Musgrove EA, Sutherland RL. Doisneau-Sixou SF, et al. Endocr Relat Cancer. 2003 Jun;10(2):179-86. doi: 10.1677/erc.0.0100179. Endocr Relat Cancer. 2003. PMID: 12790780 Review.
Cited by
- Regulation of gene expression in HBV- and HCV-related hepatocellular carcinoma: integrated GWRS and GWGS analyses.
Zhou X, Zhu HQ, Lu J. Zhou X, et al. Int J Clin Exp Med. 2014 Nov 15;7(11):4038-50. eCollection 2014. Int J Clin Exp Med. 2014. PMID: 25550913 Free PMC article. - Microenvironmental control of the breast cancer cell cycle.
Guo X, Wu Y, Hathaway HJ, Hartley RS. Guo X, et al. Anat Rec (Hoboken). 2012 Apr;295(4):553-62. doi: 10.1002/ar.22417. Epub 2012 Jan 24. Anat Rec (Hoboken). 2012. PMID: 22271550 Free PMC article. Review. - Context Matters: Response Heterogeneity to Collagen-Targeting Approaches in Desmoplastic Cancers.
Fuller AM, Eisinger-Mathason TSK. Fuller AM, et al. Cancers (Basel). 2022 Jun 26;14(13):3132. doi: 10.3390/cancers14133132. Cancers (Basel). 2022. PMID: 35804902 Free PMC article. Review. - Cold-inducible proteins CIRP and RBM3, a unique couple with activities far beyond the cold.
Zhu X, Bührer C, Wellmann S. Zhu X, et al. Cell Mol Life Sci. 2016 Oct;73(20):3839-59. doi: 10.1007/s00018-016-2253-7. Epub 2016 May 4. Cell Mol Life Sci. 2016. PMID: 27147467 Free PMC article. Review. - An Evaluation of Matrix-Containing and Humanised Matrix-Free 3-Dimensional Cell Culture Systems for Studying Breast Cancer.
Roberts GC, Morris PG, Moss MA, Maltby SL, Palmer CA, Nash CE, Smart E, Holliday DL, Speirs V. Roberts GC, et al. PLoS One. 2016 Jun 14;11(6):e0157004. doi: 10.1371/journal.pone.0157004. eCollection 2016. PLoS One. 2016. PMID: 27300768 Free PMC article.
References
- Duffy MJ, Crown J. A personalized approach to cancer treatment: how biomarkers can help. Clinical chemistry. 2008;54:1770–1779. - PubMed
- Lu J, Steeg PS, Price JE, Krishnamurthy S, Mani SA, Reuben J, Cristofanilli M, Dontu G, Bidaut L, Valero V, Hortobagyi GN, Yu D. Breast cancer metastasis: challenges and opportunities. Cancer research. 2009;69:4951–4953. - PubMed
- Geng Y, Yu Q, Sicinska E, Das M, Schneider JE, Bhattacharya S, Rideout WM, Bronson RT, Gardner H, Sicinski P. Cyclin E ablation in the mouse. Cell. 2003;114:431–443. - PubMed
- Sherr CJ, Roberts JM. Living with or without cyclins and cyclin-dependent kinases. Genes & development. 2004;18:2699–2711. - PubMed
- Butt AJ, McNeil CM, Musgrove EA, Sutherland RL. Downstream targets of growth factor and oestrogen signalling and endocrine resistance: the potential roles of c-Myc, cyclin D1 and cyclin E. Endocr Relat Cancer. 2005;12(Suppl 1):S47–59. doi: 12/Supplement_1/S47 [pii] 10.1677/erc.1.00993. - PubMed
Publication types
MeSH terms
Substances
Grants and funding
- P30 CA118100/CA/NCI NIH HHS/United States
- 1 S10 RR14668/RR/NCRR NIH HHS/United States
- S10 RR19287/RR/NCRR NIH HHS/United States
- S10 RR019287/RR/NCRR NIH HHS/United States
- P22 RR11830/RR/NCRR NIH HHS/United States
- R01 CA095898/CA/NCI NIH HHS/United States
- S10 RR016918/RR/NCRR NIH HHS/United States
LinkOut - more resources
Full Text Sources
Medical
Research Materials
Miscellaneous


