Leg length, body proportion, and health: a review with a note on beauty - PubMed (original) (raw)
Review
Leg length, body proportion, and health: a review with a note on beauty
Barry Bogin et al. Int J Environ Res Public Health. 2010 Mar.
Abstract
Decomposing stature into its major components is proving to be a useful strategy to assess the antecedents of disease, morbidity and death in adulthood. Human leg length (femur + tibia), sitting height (trunk length + head length) and their proportions, for example, (leg length/stature), or the sitting height ratio (sitting height/stature x 100), among others) are associated with epidemiological risk for overweight (fatness), coronary heart disease, diabetes, liver dysfunction and certain cancers. There is also wide support for the use of relative leg length as an indicator of the quality of the environment for growth during infancy, childhood and the juvenile years of development. Human beings follow a cephalo-caudal gradient of growth, the pattern of growth common to all mammals. A special feature of the human pattern is that between birth and puberty the legs grow relatively faster than other post-cranial body segments. For groups of children and youth, short stature due to relatively short legs (i.e., a high sitting height ratio) is generally a marker of an adverse environment. The development of human body proportions is the product of environmental x genomic interactions, although few if any specific genes are known. The HOXd and the short stature homeobox-containing gene (SHOX) are genomic regions that may be relevant to human body proportions. For example, one of the SHOX related disorders is Turner syndrome. However, research with non-pathological populations indicates that the environment is a more powerful force influencing leg length and body proportions than genes. Leg length and proportion are important in the perception of human beauty, which is often considered a sign of health and fertility.
Keywords: beauty; body proportions; disease risk; health; leg length.
Figures
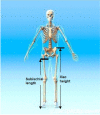
Figure 1.
Iliac height and subischial length. Credit: Roger Harris/SCIENCE PHOTO LIBRARY, royalty free image, labelling added by the authors.
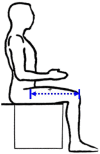
Figure 2.
Thigh length (from NHANES anthropometric manual).
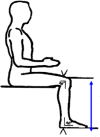
Figure 3.
Knee height (from NHANES anthropometric manual).
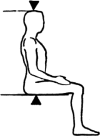
Figure 4.
Sitting Height is measured from the vertex of the head to the seated buttocks (from NHANES anthropometric manual).
Figure 5.
Approximate body proportions of Homo sapiens, Ardipithecus ramidus (4.4 MYA hominin, probable life appearance), and Pan troglodytes (chimpanzee). The figures are aligned at the crown of the head and the umbilicus to approximate a constant trunk length. Relative to trunk length, humans have the longest legs and shortest arms. Credits, Homo sapiens, SlideWrite Plus, 4.1, with authorization; Ardipithecus ramidus, Science 02 October 2009, ©J.H. Matternes,
; Pan troglodytes, Schultz, A. H. (1933). Die Körporproportionen der erwachsenen catarrhinen Primaten, mit spezieller Berüchsichtigung der Menschenaffen. Anthropologischer Anzeiger 10: 154–85 with permission of the publisher,
.
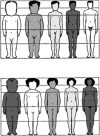
Figure 6.
Changes in body proportion during human growth after birth. Ages for each profile are, from left to right, newborn, 2 years, 6 years, 12 years, 25 years. The hair style and shading of the cartoon silhouettes are for artistic purposes and is not meant to imply any ethnic, eco-geographical, or “racial” phenotypic characteristics of the human species [provided courtesy of Dr. J. V. Basmajian].
Figure 7.
Schultz’s sketches of the body proportions of hominoid fetuses. The original legend for this figure states, “All the figures have the same sitting height. The human fetus is the 4th month, the gorilla and the gibbon fetus correspond in development to the human fetus, but the chimpanzee and the orang fetus are slightly more advanced in their growth” [, p. 465–466, accessed from
http://www.jstor.org/stable/2808286
].
Figure 8.
Human fetal circulation, adapted from [39] The relative amount of oxygen in the fetal blood is greatest in the upper thorax, neck and head; indicated by the red color of the vessels ascending from the heart. Blood flowing to the abdomen and legs is less well oxygenated; indicated by the violet color of the vessels descending from the heart.
Figure 9.
Sitting height ratio by age for the four geographic groups defined by Eveleth and Tanner [45,46]. Age 20 includes data for adults over the age of 18 years. A larger SHR indicates relatively shorter legs for total stature (authors’ original figure).
Similar articles
- Leg length, proportion, health and beauty: a review.
Bogin B, Varela-Silva MI. Bogin B, et al. Anthropol Anz. 2009 Dec;67(4):439-59. doi: 10.1127/0003-5548/2009/0036. Anthropol Anz. 2009. PMID: 20440962 Review. - Fatness biases the use of estimated leg length as an epidemiological marker for adults in the NHANES III sample.
Bogin B, Varela-Silva MI. Bogin B, et al. Int J Epidemiol. 2008 Feb;37(1):201-9. doi: 10.1093/ije/dym254. Epub 2008 Jan 9. Int J Epidemiol. 2008. PMID: 18184670 - Body proportions in patients with Turner syndrome on growth hormone treatment.
Al ADK, Şükür NM, Özturan EK, Öztürk AP, Poyrazoğlu Ş, Baş F, Darendeliler FF. Al ADK, et al. Turk J Med Sci. 2023 Apr;53(2):518-525. doi: 10.55730/1300-0144.5612. Epub 2023 Apr 19. Turk J Med Sci. 2023. PMID: 37476877 Free PMC article. - Leg length, insulin resistance, and coronary heart disease risk: the Caerphilly Study.
Smith GD, Greenwood R, Gunnell D, Sweetnam P, Yarnell J, Elwood P. Smith GD, et al. J Epidemiol Community Health. 2001 Dec;55(12):867-72. doi: 10.1136/jech.55.12.867. J Epidemiol Community Health. 2001. PMID: 11707479 Free PMC article. - [Short stature caused by SHOX gene haploinsufficiency: from diagnosis to treatment].
Jorge AA, Nishi MY, Funari MF, Souza SC, Arnhold IJ, Mendonça BB. Jorge AA, et al. Arq Bras Endocrinol Metabol. 2008 Jul;52(5):765-73. doi: 10.1590/s0004-27302008000500008. Arq Bras Endocrinol Metabol. 2008. PMID: 18797583 Review. Portuguese.
Cited by
- Arm length is associated with type 2 diabetes mellitus in Japanese-Americans.
Smits MM, Boyko EJ, Utzschneider KM, Leonetti DL, McNeely MJ, Suvag S, Wright LA, Fujimoto WY, Kahn SE. Smits MM, et al. Diabetologia. 2012 Jun;55(6):1679-84. doi: 10.1007/s00125-012-2500-x. Epub 2012 Feb 24. Diabetologia. 2012. PMID: 22361981 Free PMC article. - Changes in the Growth and Development of Adolescents in a Country in Socio-Economic Transition 1993-2013.
Robič Pikel T, Malus T, Starc G, Golja P. Robič Pikel T, et al. Zdr Varst. 2020 Jun 25;59(3):164-171. doi: 10.2478/sjph-2020-0021. eCollection 2020 Sep. Zdr Varst. 2020. PMID: 32952717 Free PMC article. - Plasticity in the growth of body segments in relation to height-for-age and maternal education in Guatemala.
Ríos L, Terán JM, Varea C, Bogin B. Ríos L, et al. Am J Hum Biol. 2020 Jul;32(4):e23376. doi: 10.1002/ajhb.23376. Epub 2019 Dec 19. Am J Hum Biol. 2020. PMID: 31854051 Free PMC article. - Early-life factors are associated with waist circumference and type 2 diabetes among Ghanaian adults: The RODAM Study.
Danquah I, Addo J, Boateng D, Klipstein-Grobusch K, Meeks K, Galbete C, Beune E, Bahendeka S, Spranger J, Mockenhaupt FP, Stronks K, Agyemang C, Schulze MB, Smeeth L. Danquah I, et al. Sci Rep. 2019 Jul 26;9(1):10848. doi: 10.1038/s41598-019-47169-6. Sci Rep. 2019. PMID: 31350427 Free PMC article. - Testing for paternal influences on offspring telomere length in a human cohort in the Philippines.
Eisenberg DTA, Rej PH, Duazo P, Carba D, Hayes MG, Kuzawa CW. Eisenberg DTA, et al. Am J Phys Anthropol. 2020 Mar;171(3):520-528. doi: 10.1002/ajpa.23983. Epub 2019 Dec 16. Am J Phys Anthropol. 2020. PMID: 31845317 Free PMC article.
References
- Gould SJ. The Mismeasure of Man. Norton; New York, NY, USA: 1981.
- Marks J. Human Biodiversity: Genes, Race, and History. Aldine De Gruyter; New York, NY, USA: 1995.
- Coon C. The Origin of Races. Knopf; New York, NY, USA: 1962.
- Tishkoff SA, Kidd KK. Implications of biogeography of human populations for ‘race’ and medicine. Nat. Genet. 2004;36:S21–S27. - PubMed
Publication types
MeSH terms
LinkOut - more resources
Full Text Sources
Research Materials
