Gut-residing segmented filamentous bacteria drive autoimmune arthritis via T helper 17 cells - PubMed (original) (raw)
Gut-residing segmented filamentous bacteria drive autoimmune arthritis via T helper 17 cells
Hsin-Jung Wu et al. Immunity. 2010.
Abstract
Commensal microbes can have a substantial impact on autoimmune disorders, but the underlying molecular and cellular mechanisms remain largely unexplored. We report that autoimmune arthritis was strongly attenuated in the K/BxN mouse model under germ-free (GF) conditions, accompanied by reductions in serum autoantibody titers, splenic autoantibody-secreting cells, germinal centers, and the splenic T helper 17 (Th17) cell population. Neutralization of interleukin-17 prevented arthritis development in specific-pathogen-free K/BxN mice resulting from a direct effect of this cytokine on B cells to inhibit germinal center formation. The systemic deficiencies of the GF animals reflected a loss of Th17 cells from the small intestinal lamina propria. Introduction of a single gut-residing species, segmented filamentous bacteria, into GF animals reinstated the lamina propria Th17 cell compartment and production of autoantibodies, and arthritis rapidly ensued. Thus, a single commensal microbe, via its ability to promote a specific Th cell subset, can drive an autoimmune disease.
Copyright 2010 Elsevier Inc. All rights reserved.
Figures
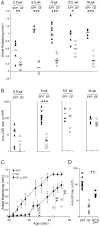
Figure 1. Attenuation of arthritis in GF K/xBN mice
(A) Ankle thickening values and (B) anti-GPI titers for GF and SPF K/BxN mice of the indicated ages. Each symbol represents one animal; bars indicate the group mean. (C) GF K/BxN mice were shipped to our SPF facility and upon weaning (day 21), ankle thickening was measured from day 23. Closed circles: average of ankle thickening ± s.e.m, serially measured on cohorts. Closed triangles: analogous measurements for SPF-housed K/BxN mice. Open circles: values for individual GF-housed K/BxN mice, not measured serially due to experimental contingencies. (D) Sera were collected at the end of the experiment depicted in panel C. The bar indicates the mean. Asterisks indicate statistical significance using the Student s t-Test (*P=0.05, **P<0.05, ***P<0.005)
Figure 2. Impact of commensal flora on the B and T cell compartments of K/BxN mice
(A) Splenocytes from GF or SPF BxN or K/BxN mice were stained with Abs recognizing B220, CD4, or FAS or with PNA-R, and were analyzed by flow cytometry, gating as indicated. Values indicate the percentages of Fas+PNA-R+ cells in total B cells. Data are representative of two independent experiments. (B) Splenocytes from GF or SPF BxN or K/BxN mice were stained with mAbs recognizing B220, CD4, CXCR5 and PD-1, and were analyzed by flow cytometry, gating as indicated. Values indicate the percentages of CXCR5+PD-1+ cells in total CD4+ T cells. Data are representative of two independent experiments. (C). Purified B cells of GF or SPF BxN or K/BxN mice were stimulated with GPI protein (10μg/ml) for 6 hrs. An ELISPOT assay revealed GPI-specific ASCs. Fraction of GPI-specific ASCs among total B cells; mean + s.e.m from two independent experiments. (D) Splenocytes were isolated from SPF or GF K/BxN mice, stained and analyzed by flow cytometry. The values indicate percentages of CD44+ cells in CD4+ T cells. Data are representative of two independent experiments [SPF BxN: 23.3 +/− 0.9 s.e.m. (n=2); SPF K/BxN: 61.8 +/− 4.8 s.e.m. (n=3); GF BxN: 22.1 +/− 4.5 s.e.m. (n=2); GF K/BxN: 61.3 +/− 3.2 s.e.m. (n=4)]. (E) Splenocytes were isolated from SPF and GF K/BxN mice and stimulated with GPI282–294 peptide at the indicated concentration. Data are representative of 2 independent experiments. Asterisks indicate statistical significance using the Student s t-Test, *P<0.05.
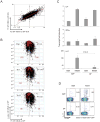
Figure 3. A defective Th17 signature in GF K/BxN mice
(A) FC (fold change) vs FC plot comparing gene-expression values of SPF K/BxN vs BxN mice (x axis) and GF K/BxN vs BxN mice (y axis). Gene-expression values of each group were the average values of 3 chips from 3 independent experiments. (B) Th cell signatures. Th2, Th1 and Th17 cell signatures were generated from published datasets (Nurieva et al., 2008), using 2 as the cut-off for FC over the expression value of two other cell types. The volcano plots depict the FC for SPF vs GF K/BxN CD4+ T cells versus the p value of the FC. Signature genes are superimposed in red. Values refer to the number of genes upregulated (right) or downregulated (left) in GF vis-à-vis SPF T cells. P values from a X2 test are indicated. (C) IL-4, IFN-γ and IL-17 transcripts in splenic CD4+ T cells for GF or SPF of B/N or K/BxN mice were quantified by RT-PCR. The level in SPF BxN mice was set as 1. Mean + s.e. Results were compiled from three independent experiments with two mice per group. P =0.01 for transcriptional fold-induction of IL-17 (SPF vs. GF K/BxN). (D) Splenocytes of GF or SPF BxN or K/BxN mice were stained with Abs recognizing CCR6 and IL-17, and were analyzed by flow cytometry. Values represent percentages of IL-17+CCR6+ cells in CD3+CD4+B220− cells. Data are representative of two independent experiments.
Figure 4. Reduction of arthritis by neutralization of IL-17
(A) 25-day-old SPF K/BxN mice were treated with 100μg of anti-IL-17 or control rat IgG every 3 days, and ankle thickening was measured over time (left panel). Mean ± s.e of the two groups (n=5 in both groups from two independent experiments is plotted; Asterisks indicate statistical significance using the Student s t-Test, *P<0.05.). Sera were collected at the end of the experiment, and anti-GPI titers quantified (right panel). Symbols represent individual mice; bar indicates the mean. (B) At 23 days of age, GF mice were transferred to our SPF facility, and were treated with 100μg anti-IL-17 or control rat IgG every 3 days from day 24. Otherwise as in the A panels (n=4 in both groups from one experiment; Asterisks indicate statistical significance using the Student s t-Test, *P<0.05). (C) SPF K/BxN mice were treated as in panel A. At the end of treatment, splenocytes were isolated and stained with Abs recognizing B220, CD4 or Fas, or with PNA, and were analyzed by flow cytometry, gating as indicated. Values represent the percentages of Fas+PNA-R+ cells in total B cells. Data are representative of two independent experiments with two mice per group. (D) B cells from either WT or _Il17ra_−/− mice were combined with splenocytes from arthritic K/BxN mice and transferred into BxN._Rag1_−/− recipients. The origins of B cells were identified by expression of the congenic marker: CD45.1+CD45.2+ for K/BxN B cells and CD45.2 for _Il17ra_−/− or WT B cells. Percentages of K/BxN B cells and _Il17ra_−/− or WT B cells among total B cell or GC B cell populations are indicated. The quantitative data of _Il17ra_−/− or WT B cell percentage among total B cells and GC B cells were also shown as mean + s.e. (n=4, data combined from two independent experiments).
Figure 5. Linking gut and spleen IL-17 cells
(A) SI-LP lymphocytes were isolated from SPF or GF K/BxN mice. Cells were stained, analyzed by flow cytometry and gated as indicated. Expression of IL-17 versus CCR6 is plotted. The values indicate percentages of IL-17+CCR6+ cells in CD3+CD4+B220− cells. Data are representative of three independent experiments. (B) SI-LP lymphocytes (i) and splenocytes (ii) were isolated from SPF mice of the indicated ages, stained and analyzed by flow cytometry, gated as indicated. Plots displayed IL-17 versus CCR6 expression. Values indicate % of IL-17+CCR6+ cells in total CD4+ T cells (CD3+CD4+B220−). Data are representative of two independent experiments. (iii) Measurement of ankle thickening for the same mice. Each circle represents one animal from two independent experiments. (C) Splenocytes from SPF BxN or K/BxN mice were stained and analyzed by flow cytometry, gated as indicated. Plots depict IL-17 versus α4β7 staining. Values indicate % of IL-17+α4β7+ or IL-17+α4β7− cells in total CD4+ T cells (CD3+CD4+B220−). Data are representative of two independent experiments.
Figure 6. Effects of various antibiotics
(A) Representative dot plots examining expression of IL-17 and CCR6 by SI-LP lymphocytes in untreated or the indicated antibiotic-treated SPF K/BxN mice, treated from birth to 5 wks of age. Values refer to % of the gated population in total CD4+ T cells. Representative of two independent experiments. (B) SPF K/BxN mice were treated with metronidazole (1g/l), neomycin (1g/l), vancomycin (0.5g/l) or ampicillin (1g/l) in the drinking water from birth. At 5 weeks of age, SI-LP lymphocytes (left) and splenocytes (right) were isolated, stained and analyzed by flow cytometry. Plotted are the % of IL-17+ cells of total CD4+ T cells. Mean + s.e. (data was a combination of two independent experiments with mice treated with metronidazole (n=4), neomycin (n=4), vacomycin (n=4), ampicillin (n=4) or nothing (n=8)) Asterisks indicate statistical significance using the Student s t-Test, **P<0.005. (C) Representative dot plots examining expression of α4β7 on IL-17-producing splenocytes in untreated (left) or vancomycin-treated (right) SPF K/BxN mice, treated from birth to 5 wks of age. Values refer to % of the gated population in total CD4+ T cells. Representative of two independent experiments. (D) K/BxN mice were untreated or were treated with metronidazole (1g/l), neomycin (1g/l), ampicillin (1g/L) or vancomycin (0.5g/l) in the drinking water from birth. Ankle thickening was followed from day 27. Mean ± s.e. (none group: n=5; all other antibiotics treated groups: n=4). Asterisks indicate statistical significance of area under curve using the Student s t-Test, **P<0.005. Representative of two independent experiments.
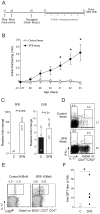
Figure 7. Triggering of arthritis in SFB-colonized GF K/BxN mice
(A) Experimental scheme. Mice were shipped from the GF Taconic facility to the SPF NYU facility on day 21 after birth and arrived the next day. After a 3-day rest; they were gavaged with SFB mono-feces or control GF feces (the rare animal with already swollen ankles was not used). Ankle thickening was measured every day from day 27 to day 33. (B) Measurement of ankle thickness beginning on day 27. N=9 for SFB-treated and N=5 for controls from 4 independent experiments. Asterisks indicate statistical significance using the Student s t-Test, *P<0.05. (C) Quantitative PCR analysis of SFB and total bacterial (EUB) 16S rRNA genes in mouse feces. GF K/BxN mice were gavaged either with their own feces (C) or with feces from SFB mono-colonized mice (SFB). Genomic DNA was isolated from fecal pellets on day 6 after gavage. Data combined from two separate experiments. (D) SI-LP lymphocytes were isolated from control or SFB- inoculated K/BxN mice. Cells were stained and analyzed by flow cytometry. Expression of IL-17 versus IFN-γ is plotted. Values refer to % of the gated population in total CD4+TCRβ+ cells. (E) Splenocytes were isolated from control or SFB-inoculated K/BxN mice, and were stained and analyzed by flow cytometry, gated as indicated. Plots depict IL-17 versus α4β7 staining. Values indicate % of IL-17+α4β7+ or IL-17+α4β7− cells in total CD4+ T cells (B220− CD3+CD4+). Data are representative of two independent experiments. (F) Sera were collected from control or SFB-inoculated K/BxN animals at the end of the experiment depicted in panel A. The bar indicates the mean. Asterisks indicate statistical significance using the Student s t-Test, *P<0.05.
Comment in
- Commensal flora: friends or foes?
Kosiewicz MM, Chhabra AY, Zirnheld AL, Alard P. Kosiewicz MM, et al. Immunotherapy. 2011 Mar;3(3):313-4. doi: 10.2217/imt.11.1. Immunotherapy. 2011. PMID: 21395373 No abstract available.
References
- Atarashi K, Nishimura J, Shima T, Umesaki Y, Yamamoto M, Onoue M, Yagita H, Ishii N, Evans R, Honda K, et al. ATP drives lamina propria T(H)17 cell differentiation. Nature. 2008;455:808–812. - PubMed
- Backhed F, Ley RE, Sonnenburg JL, Peterson DA, Gordon JI. Host-bacterial mutualism in the human intestine. Science. 2005;307:1915–1920. - PubMed
- Binstadt BA, Patel PR, Alencar H, Nigrovic PA, Lee DM, Mahmood U, Weissleder R, Mathis D, Benoist C. Particularities of the vasculature can promote the organ specificity of autoimmune attack. Nat Immunol. 2006;7:284–292. - PubMed
Publication types
MeSH terms
Substances
Grants and funding
- T32 AI007386/AI/NIAID NIH HHS/United States
- T32 CA007386/CA/NCI NIH HHS/United States
- RC1 AI087266/AI/NIAID NIH HHS/United States
- RC1AI 087266/AI/NIAID NIH HHS/United States
- P01 AI065858/AI/NIAID NIH HHS/United States
- K99 DK085329/DK/NIDDK NIH HHS/United States
- 1K99DK085329-01/DK/NIDDK NIH HHS/United States
LinkOut - more resources
Full Text Sources
Other Literature Sources
Medical
Molecular Biology Databases


