Sar1 assembly regulates membrane constriction and ER export - PubMed (original) (raw)
Sar1 assembly regulates membrane constriction and ER export
Kimberly R Long et al. J Cell Biol. 2010.
Abstract
The guanosine triphosphatase Sar1 controls the assembly and fission of COPII vesicles. Sar1 utilizes an amphipathic N-terminal helix as a wedge that inserts into outer membrane leaflets to induce vesicle neck constriction and control fission. We hypothesize that Sar1 organizes on membranes to control constriction as observed with fission proteins like dynamin. Sar1 activation led to membrane-dependent oligomerization that transformed giant unilamellar vesicles into small vesicles connected through highly constricted necks. In contrast, membrane tension provided through membrane attachment led to organization of Sar1 in ordered scaffolds that formed rigid, uniformly nonconstricted lipid tubules to suggest that Sar1 organization regulates membrane constriction. Sar1 organization required conserved residues located on a unique C-terminal loop. Mutations in this loop did not affect Sar1 activation or COPII recruitment and enhanced membrane constriction, yet inhibited Sar1 organization and procollagen transport from the endoplasmic reticulum (ER). Sar1 activity was directed to liquid-disordered lipid phases. Thus, lipid-directed and tether-assisted Sar1 organization controls membrane constriction to regulate ER export.
Figures
Figure 1.
Sar1 deforms and tubulates GUVs. (A) GUVs (84.5 mol% DOPC, 5 mol% DOPS, 10 mol% cholesterol, and 0.5 mol% Texas red DHPE) are shown. (B) GUVs incubated with Sar1-GDP in the presence of 2 mM GDP were not tubulated. (C and D) GUVs (as in A) were incubated with Sar1-GTP in the presence of 2 µM BSA, HM buffer (25 mM Hepes-KOH, pH 7.2, and 2.5 mM Mg(OAc)2), 2.5 mM EDTA, and 2 mM GTP for 2 h at 32°C. Sar1 formed flexible (C) and rigid tubules (minor product; D). (E) GUVs incubated with Sar1-GTP in the absence of BSA form flexible (not depicted) and rigid tubules. (F and G) GUVs incubated with wt Sar1 as in E form flexible (F) and rigid (G) tubules. (H) 1 µg Sar1 proteins in high salt (25 mM Hepes-KOH, pH 7.2, 125 mM KOAc, and 1 mM Mg(OAc)2) or low salt (15 mM Hepes-KOH, pH 7.2, 50 mM sorbitol, and 2.5 mM Mg(OAc)2) were analyzed by SDS-PAGE and Coomassie blue staining. Arrows point to high molecular weight (MW) Sar1 proteins. (I and J) 1 µg Sar1 was incubated in the absence or presence of liposomes and 2 mM GDP (D) or GTP (T) as indicated. 100 µM BS3 cross-linker was subsequently added when indicated. The reactions were fractionated to pellet (I) and supernatant (J) and analyzed by Western blots using Sar1-specific antibodies. Bars, 10 µm.
Figure 2.
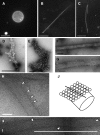
Formation of a protofilament-like scaffold of Sar1 on lipid tubules. (A and B) Fluorescent GUVs (54.5 mol% DOPC, 35 mol% DOPS, 10 mol% cholesterol, and 0.5 mol% Texas red DHPE) were incubated without (A) or with (B) Sar1-GTP in a KHM buffer containing 2.5 mM EDTA and 2 mM GTP for 2 h at 32°C and imaged in solution. (C) GUVs (84.5 mol% DOPC, 5 mol% DOPS, 10 mol% cholesterol, and 0.5 mol% Texas red DHPE) were incubated with Sar1-GTP as in Fig. 1, fixed, and analyzed for Sar1 coating using indirect immunofluorescence with anti-Sar1 antibodies. (D and E) Samples prepared as in B were adhered to glow-discharged EM grids and stained with 1% uranyl acetate for imaging by EM. “Beads on a string”–like appearance with vesicle-like structures and constricted vesicle necks suggestive of flexible lipid tubules are shown. (E) 2% paraformaldehyde was added before staining. (F–I) A striated helical-like parallel repeat pattern was detected on rigid-like tubules. Tubulation reactions were performed in the presence (F, H, and I) or absence (G) of 125 mM KOAc. (H and I) Arrowheads point to repeated banding detected on tubule surfaces. (J) A model depicting helical organization of Sar1 on the lipid tube is shown. Open circles represent Sar1 proteins. Bars: (A–C) 10 µm; (D, E, and I) 500 nm; (F and G) 100 nm; (H) 42 nm.
Figure 3.
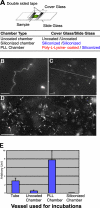
Membrane attachment controls Sar1 organization. (A) Schematic representation of reaction chamber assembly. Uncoated chamber was assembled from uncoated cover and slide glasses. Siliconized and PLL chambers were assembled by placing siliconized or PLL-coated cover glasses onto siliconized slide glass. (B) GUVs (84.5 mol% DOPC, 5 mol% DOPS, 10 mol% cholesterol, and 0.5 mol% Texas red DHPE) were incubated with Sar1-GTP in a siliconized chamber for 1 h at 32°C. Flexible tubules were exclusively detected. (C and D) GUVs were incubated with Sar1-GTP in a PLL chamber as in B. The foci of the pictures are taken at the surface of the PLL-coated cover glass. Rigid tubules (D, arrows) were abundant on the PLL-coated glass surface. Images of high and low magnification are shown. (E) Quantification of rigid tubule formation. AU = (mean number of formed rigid tubules/mean number of lipid signals indicative of lipid bilayers before the reaction) × 100 (see Materials and methods). Error bars indicate standard deviation. Bars: (B and C) 10 µm; (D) 50 µm.
Figure 4.
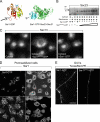
The Ω loop is required for Sar1-induced rigid tubule formation. (A) The structure of hamster Sar1a bound to GDP (Huang et al., 2001) and GTP-bound Sar1 assembled with Sec23 and Sec31 (Bi et al., 2007). Arrows point to the Ω loop. (B) Sar1QTTG-GTP recruits Sec23/24. NRK membranes were incubated with cytosol in the presence of 1 µg Sar1-GTP or increasing concentrations (0.1–2 µg/60 µl) of Sar1QTTG-GTP as indicated, washed, and Sec23/24 recruitment was determined by Western blotting with a Sec23-specific antibody. The first lane shows control incubation with Sar1-GTP, cytosol, and no membranes. (C) Sar1QTTG-GTP recruits Sec13/31. NRK cells were permeabilized and incubated with cytosol and 2 µg/220 µl Sar1-GTP or Sar1QTTG-GTP for 30 min at 32°C. The distribution of Sec13/31 was determined by indirect immunofluorescence using a Sec13-specific antibody. Note the punctate localization of recruited Sec13 at ERES. (D and E) Sar1QTTG-GTP does not generate rigid tubules. (D) NRK cells were permeabilized and incubated without cytosol in the presence of 2 (top) or 20 µg (bottom; 220 µl final volume) Sar1-GTP or Sar1QTTG-GTP as indicated. The distribution of Sar1 was determined by indirect immunofluorescence. (E) GUVs (as in Fig. 3) were incubated with 5 µM Sar1-GTP or Sar1QTTG-GTP. Tubules were visualized in solution using Texas red DHPE (PE). Bars: (C and D) 5 µm; (E) 10 µm.
Figure 5.
Sar1-GTP proteins tubulate LUVs. (A and B) LUVs composed of 20 mol% cholesterol, 75 mol% DOPC, and 5 mol% DLPA were prepared as described previously (Bielli et al., 2005) with the following modification. Lipids were rehydrated in a buffer containing 25 mM Hepes-KOH, pH 7.2, 1 mM Mg(OAc)2, and 50 mM sorbitol for 1 h at 37°C. LUVs were sized by repetitive extrusion through a polycarbonate filter (400-nm pores; Avanti Polar Lipids, Inc.). Resulting LUVs (150–300-nm diameter) were incubated with 5 µM of either Sar1-GTP (A) or Sar1QTTG-GTP (B) for 2 h at 32°C in a KHM buffer containing 2.5 mM EDTA, 2.5 mM Mg(OAc)2, and 2 mM GTP. Samples were adhered to glow-discharged EM grids and stained with 1% uranyl acetate for EM analysis. Note the uniform appearance of tubules generated by Sar1-GTP (A) and the irregular morphology of tubules generated by Sar1QTTG-GTP (B). Arrowheads indicate a repetitive banding pattern (A) and areas of increased membrane constriction (B). Bars, 100 nm.
Figure 6.
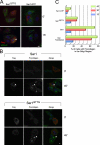
Expression of Sar1QTTG inhibits the traffic of procollagen from the ER to the Golgi. (A) MDCK cells expressing tsVSV-G–GFP (stable Tet-off expression) were transfected with Flag-Sar1QTTG or Flag-Sar1-GTP as indicated. Tetracycline was removed, and cells were incubated at 40°C to accumulate tsVSV-G–GFP in the ER. Cells were shifted to 32°C for 15 min. The expression of Flag-Sar1 (red) and the localization of tsVSV-G–GFP (green) were determined using indirect immunofluorescence. The arrowhead indicates arrival and concentration of tsVSV-G–GFP at the Golgi in a Flag-Sar1QTTG–expressing cell. (B) NIH3T3 cells were transiently transfected with Flag-Sar1 proteins as indicated. The cells were treated with ascorbate to induce the ER export of procollagen for the indicated time. The expression of Sar1 proteins and the localization of endogenous procollagen type I were determined by indirect immunofluorescence. Arrowheads indicate arrival and concentration of procollagen at the Golgi in a Flag-Sar1–expressing cell (top) or nontransfected cell (bottom) located next to cells expressing Flag-Sar1QTTG where transport is not observed. (C) Bar graphs represent quantification of the arrival and concentration of procollagen at the Golgi region in cells expressing Sar1a proteins (Sar1 wt, Sar1QTTG, Sar1-GTP, or nontransfected cells) at the indicated times after ascorbate addition, conducted on three independent experiments where each expression group (134–723 cells/group/time point) was pooled and analyzed in a cumulative manner. To estimate the variability between experiments, we independently requantified the 45-min time point for individual experiments comparing traffic of procollagen in cells expressing Sar1 wt (total of 325 cells) to traffic in cells expressing Sar1QTTG (423 cells) or Sar1-GTP (222 cells). Sar1QTTG and Sar1-GTP inhibited procollagen traffic by 57.37 ± 3.83% and 86.63 ± 0.75% (SEM; n = 3 experiments), respectively, compared with Sar1 wt, which is in agreement with cumulative analysis (60.75% and 83.9%, respectively). Bars, 5 µm.
Figure 7.
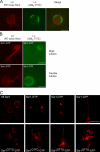
Sar1 activity is directed to Ld phases. (A) GUVs composed of DOPC/cholesterol/brain sphingomyelin (3:1:3) supplemented with 1% DOPS, 1% GM1, and 0.5% Texas red DHPE (PE) were electroformed in 25 mM Hepes-KOH, pH 7.2, at 65°C. The Lo phase was labeled with 2.5 µg/ml FITC-tagged cholera toxin B subunit (Lo probe). Texas red DHPE is incorporated in the Ld phase. (B) 20 ng/µl GUVs were reacted with 5 µM Sar1-GTP in the presence of 2.5 µg/ml FITC cholera toxin B subunit for 2 h at 27°C or RT in a PLL chamber (see Materials and methods). (C) 5 µM Δ9Sar1, Sar1-GTP, or Sar1QTTG-GTP was incubated as in B without the Lo probe in reactions containing GUVs produced in sucrose buffers, and tubulation morphology was analyzed. (B) Note that phase-separated GUVs inhibited Sar1 tubulation activity. Sar1 preferentially constricted Ld phase into flexible and rigid tubules. (C) Note that distinct tubular morphologies were observed with Sar1QTTG-GTP. Bars, 10 µm.
Figure 8.
Sar1 assemblies and membrane constriction. (A) Sar1 utilizes the N terminus to constrict membranes and the Ω loop to organize Sar1 in scaffolds to regulate membrane constriction. (B) Based on an ADE model, the concentration of inserted Sar1 N terminus, which is controlled by assembly, can increase locally to induce membrane fission (pink bars, Sar1; red circles, N termini). (C) Sar1 (red circles) organization with relation to the assembled COPII cage. Nonconstricted tubules coated at the tip with COPII are visible in vitro (Aridor et al., 2001) and in vivo in fibroblasts derived from CLSD patients (Fromme et al., 2007). Vesicles connected through constricted necks are visible at ERES when fission is arrested with a GTPase-deficient Sar1 (Bielli et al., 2005). As depicted in the model, Sar1 is required in excess to support vesicle fission (Bielli et al., 2005).
Similar articles
- Regulation of Sar1 NH2 terminus by GTP binding and hydrolysis promotes membrane deformation to control COPII vesicle fission.
Bielli A, Haney CJ, Gabreski G, Watkins SC, Bannykh SI, Aridor M. Bielli A, et al. J Cell Biol. 2005 Dec 19;171(6):919-24. doi: 10.1083/jcb.200509095. Epub 2005 Dec 12. J Cell Biol. 2005. PMID: 16344311 Free PMC article. - Insights into the mechanisms of membrane curvature and vesicle scission by the small GTPase Sar1 in the early secretory pathway.
Hariri H, Bhattacharya N, Johnson K, Noble AJ, Stagg SM. Hariri H, et al. J Mol Biol. 2014 Nov 11;426(22):3811-3826. doi: 10.1016/j.jmb.2014.08.023. Epub 2014 Sep 2. J Mol Biol. 2014. PMID: 25193674 Free PMC article. - Sar1 GTPase Activity Is Regulated by Membrane Curvature.
Hanna MG 4th, Mela I, Wang L, Henderson RM, Chapman ER, Edwardson JM, Audhya A. Hanna MG 4th, et al. J Biol Chem. 2016 Jan 15;291(3):1014-27. doi: 10.1074/jbc.M115.672287. Epub 2015 Nov 6. J Biol Chem. 2016. PMID: 26546679 Free PMC article. - COPII coat assembly and selective export from the endoplasmic reticulum.
Sato K. Sato K. J Biochem. 2004 Dec;136(6):755-60. doi: 10.1093/jb/mvh184. J Biochem. 2004. PMID: 15671485 Review. - The small GTPase Sar1, control centre of COPII trafficking.
Van der Verren SE, Zanetti G. Van der Verren SE, et al. FEBS Lett. 2023 Mar;597(6):865-882. doi: 10.1002/1873-3468.14595. Epub 2023 Feb 20. FEBS Lett. 2023. PMID: 36737236 Review.
Cited by
- Sec24p and Sec16p cooperate to regulate the GTP cycle of the COPII coat.
Kung LF, Pagant S, Futai E, D'Arcangelo JG, Buchanan R, Dittmar JC, Reid RJ, Rothstein R, Hamamoto S, Snapp EL, Schekman R, Miller EA. Kung LF, et al. EMBO J. 2012 Feb 15;31(4):1014-27. doi: 10.1038/emboj.2011.444. Epub 2011 Dec 9. EMBO J. 2012. PMID: 22157747 Free PMC article. - Sar1, a Novel Regulator of ER-Mitochondrial Contact Sites.
Ackema KB, Prescianotto-Baschong C, Hench J, Wang SC, Chia ZH, Mergentaler H, Bard F, Frank S, Spang A. Ackema KB, et al. PLoS One. 2016 Apr 21;11(4):e0154280. doi: 10.1371/journal.pone.0154280. eCollection 2016. PLoS One. 2016. PMID: 27101143 Free PMC article. - ER exit in physiology and disease.
Robinson CM, Duggan A, Forrester A. Robinson CM, et al. Front Mol Biosci. 2024 Jan 18;11:1352970. doi: 10.3389/fmolb.2024.1352970. eCollection 2024. Front Mol Biosci. 2024. PMID: 38314136 Free PMC article. Review. - The plant membrane surrounding powdery mildew haustoria shares properties with the endoplasmic reticulum membrane.
Kwaaitaal M, Nielsen ME, Böhlenius H, Thordal-Christensen H. Kwaaitaal M, et al. J Exp Bot. 2017 Dec 16;68(21-22):5731-5743. doi: 10.1093/jxb/erx403. J Exp Bot. 2017. PMID: 29237056 Free PMC article. - Delineating the shape of COat Protein complex-II coated membrane bud.
Paul S, Audhya A, Cui Q. Paul S, et al. PNAS Nexus. 2024 Jul 26;3(8):pgae305. doi: 10.1093/pnasnexus/pgae305. eCollection 2024 Aug. PNAS Nexus. 2024. PMID: 39108303 Free PMC article.
References
Publication types
MeSH terms
Substances
Grants and funding
- R56 DK062318/DK/NIDDK NIH HHS/United States
- R01 DK062318/DK/NIDDK NIH HHS/United States
- T32 DK061296/DK/NIDDK NIH HHS/United States
- T32-DK061296/DK/NIDDK NIH HHS/United States
- DK062318/DK/NIDDK NIH HHS/United States
LinkOut - more resources
Full Text Sources
Other Literature Sources

