KappaB-Ras is a nuclear-cytoplasmic small GTPase that inhibits NF-kappaB activation through the suppression of transcriptional activation of p65/RelA - PubMed (original) (raw)
KappaB-Ras is a nuclear-cytoplasmic small GTPase that inhibits NF-kappaB activation through the suppression of transcriptional activation of p65/RelA
Kenji Tago et al. J Biol Chem. 2010.
Abstract
NF-κB is an important transcription factor involved in various biological responses, including inflammation, cell differentiation, and tumorigenesis. κB-Ras was identified as an IκB-interacting small GTPase and is reported to disturb cytokine-induced NF-κB activation. In this study, we established that κB-Ras is a novel type of nuclear-cytoplasmic small GTPase that mainly binds to GTP, and its localization seemed to be regulated by its GTP/GDP-binding state. Unexpectedly, the GDP-binding form of the κB-Ras mutant exhibited a more potent inhibitory effect on NF-κB activation, and this inhibitory effect seemed to be due to suppression of the transactivation of a p65/RelA NF-κB subunit. κB-Ras suppressed phosphorylation at serine 276 on the p65/RelA subunit, resulting in decreased interaction between p65/RelA and the transcriptional coactivator p300. Interestingly, the GDP-bound κB-Ras mutant exhibited higher interactive affinity with p65/RelA and inhibited the phosphorylation of p65/RelA more potently than wild-type κB-Ras. Taken together, these findings suggest that the GDP-bound form of κB-Ras in cytoplasm suppresses NF-κB activation by inhibiting its transcriptional activation.
Figures
FIGURE 1.
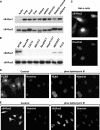
κB-Ras is a nuclear-cytoplasm shuttling small GTPase. A, immunoblotting analysis of κB-Ras1 and κB-Ras2 in adult mouse tissues. Upper and lower photographs show the expression of κB-Ras1 and κB-Ras2. B, immunoblotting analysis of κB-Ras1 and κB-Ras2 in lysates of various human and mouse cell lines. C, immunostaining analysis of κB-Ras2 in HeLa cells. Endogenous κB-Ras2 was detected by anti-κB-Ras2 polyclonal antibody and Alexa594-conjugated secondary antibody. Nucleus was visualized by Hoechst 33258. D, confocal microscopy analysis of κB-Ras2 expressed in NIH-3T3 cells. NIH-3T3 cells expressing FLAG-κB-Ras2 were treated with LMB for 6 h. κB-Ras2 localization was detected by anti-FLAG (M2) antibody and anti-mouse IgG conjugated with Alexa594. Nucleus was visualized by Hoechst 33258. E, confocal microscopy analysis of endogenous κB-Ras2 in HeLa cells. Cells were treated with LMB as in D. κB-Ras2 localization was detected by anti-κB-Ras2 antibody and anti-mouse IgG conjugated with Alexa594. Nucleus was visualized by Hoechst 33258.
FIGURE 2.
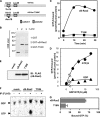
T18N mutant of κB-Ras exhibits low affinity to GTP. A, molecular scheme of wild-type κB-Ras2 and T18N mutant. B, purified recombinant GST, GST-κB-Ras2, and GST-T18N mutant were analyzed by Coomassie Brilliant Blue (CBB) staining. C, GTPγS binding activity of κB-Ras2 and T18N mutant in vitro. Recombinant proteins of κB-Ras2 and T18N mutant were incubated with [35S]GTPγS during the indicated periods, and then protein-GTPγS complexes were collected on a nitrocellulose membrane. D, binding ability of κB-Ras2 to GTPγS and GDP was tested. Recombinant protein of κB-Ras2 was incubated with the indicated concentration of [35S]GTPγS or [3H]GDP for 30 min. Protein-GTPγS or -GDP complexes were collected on a nitrocellulose membrane, and radioactivity was measured. E, expressions of κB-Ras2 and T18N mutant in HEK293T cells. F, cells expressing FLAG-κB-Ras2 or T18N were metabolically labeled with [32P]phosphorus. Cell lysates were utilized for immunoprecipitation using anti-FLAG (M2) antibody. Bound guanine nucleotides were developed by TLC. G, percentage of GTP-bound form is shown on the graph. Error bars, S.D. (n = 3). IP, immunoprecipitation; IB, immunoblot.
FIGURE 3.
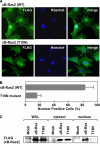
κB-Ras changes its localization in a GTP/GDP-dependent manner. A, immunostaining analysis of κB-Ras2 and T18N mutant in NIH-3T3 cells. Experiments were performed as in Fig. 1, C and D. κB-Ras2 localization was detected by anti-FLAG (M2) antibody and anti-mouse IgG conjugated with Alexa594 (green). Nucleus was visualized by Hoechst 33258 (blue). To confirm the localization of κB-Ras2, merged photographs are shown. B, percentage of positive cells with nuclear localization of κB-Ras2 and T18N mutant in NIH-3T3 cells were calculated and are shown in the graph. In the graph, error bars indicate S.D. (n = 3). C, to analyze the subcellular localization of the GDP- or GTP-bound form of κB-Ras, cytosolic and nuclear fractions were prepared from HEK293T cells expressing FLAG-κB-Ras2 or T18N. Each fraction was analyzed by immunoblot analysis with anti-FLAG (M2) antibody. WCL, whole cell lysate.
FIGURE 4.
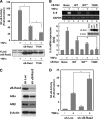
Effect of κB-Ras on cytokine-induced NF-κB activation. A, HEK293T cells transfected with pNF-κB-luciferase plus FLAG-κB-Ras2 or T18N were stimulated with TNFα, and luciferase activity was measured. To verify the protein expression, immunoblot analysis was performed for κB-Ras2 and T18N mutant. B, HEK293T cells seeded on a 60-mm dish were transfected with κB-Ras2 (0.1 or 0.3 μg) or T18N (1 μg). Cells expressing κB-Ras2 (0.1 or 0.3 mg) or T18N were stimulated with TNFα. RT-PCR analysis for IL-8 and GAPDH was performed. The expression level of κB-Ras2 and T18N mutant was evaluated by immunoblot analysis. In the experiments in C and D, NIH-3T3 cells that stably harbor κB-responsive luciferase gene (KF-8 cells) were utilized. C, KF-8 cells were infected with retrovirus harboring shRNA for luciferase (sh-Luc) or murine κB-Ras2 (sh_-κ_B-Ras2). Six days later, cells were harvested for immunoblot analysis to test the expressions of κB-Ras2, IκBα, IκBβ, and β-actin. D, KF-8 cells stably harboring the κB-luciferase gene were infected with control virus (sh-luciferase) or sh-κB-Ras2 virus. Cells were stimulated with TNFα (10 ng/ml) for 12 h. Cells were harvested, and luciferase activity was measured. In each experiment, error bars = S.D. (n = 3; *, p < 0.005).
FIGURE 5.
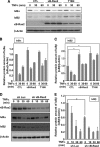
Effect of κB-Ras on TNFα-induced IκB degradation. A, FLAG-κB-Ras2 and T18N were ectopically expressed in HEK293T cells. Forty eight hours later, cells were stimulated with/without TNFα (10 ng/ml) for the indicated periods, and cells were then lysed with lysis buffer. Obtained lysates were analyzed by immunoblot analysis using anti-IκBα, IκBβ, and β-actin antibodies. CTL, control. To detect overexpressed κB-Ras2, anti-FLAG (M2) antibody was utilized. The degradation of IκBα and IκBβ was normalized with the protein of β-actin, and the quantified ratios of IκBα and IκBβ are shown in B and C, respectively. In each experiment, error bars = S.D. (n = 3; *, p < 0.005). D, NIH-3T3 cells were infected with control virus (sh-Luc) or sh-κB-Ras2 virus. Six days later, cells were stimulated with 10 ng/ml TNFα for the indicated periods and then harvested for immunoblot analysis to test the expressions of κB-Ras2, IκBα, IκBβ, and β-actin. E, relative protein of IκBα and IκBβ was normalized with the protein of β-actin, and the quantified ratios of IκBα and IκBβ are shown. Error bars, S.D. (n = 3; *, p < 0.005).
FIGURE 6.
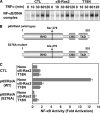
κB-Ras inhibits p65/RelA activation in an IκBβ stabilization-independent manner. A, HEK293T cells expressing κB-Ras2 or T18N were stimulated with TNFα for the indicated periods, and nuclear extracts were then prepared and analyzed by EMSA using an NF-κB-specific probe. CTL indicates control cells transfected with empty vector. B, schemes of wild-type p65/RelA and p65/RelA (S276A) mutant were drawn. RHD, CBD, and TAD indicate Rel homology domain, CBP/p300-binding domain, and transcriptional activating domain, respectively. Numbers mean the position of amino acids in p65/RelA. C, HEK293T cells were transfected with pNF-κB-luciferase plus the indicated combination of plasmids encoding wild-type p65/RelA, p65/RelA (S276A), FLAG-κB-Ras2, and/or T18N mutant. Cells were harvested, and the luciferase activity in each transfected cell was measured. CTL indicates cells transfected without p65/RelA (WT) or p65/RelA (S276A) mutant. Error bars, S.D. (n = 3).
FIGURE 7.
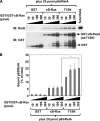
GDP-bound form of κB-Ras directly interacts with p65/RelA. A, direct interaction between κB-Ras2/T18N and p65/RelA was analyzed by in vitro pulldown assay. Various amounts (10, 30, 100, and 300 pmol) of GST-κB-Ras2 (wild type) or T18N were incubated with 10 μ
m
GTPγS or GDP for 30 min. Then 20 pmol of recombinant p65/RelA was added. Binding reaction was performed for 30 min at 25 °C, and then protein complexes were collected using glutathione-Sepharose. Protein complexes were analyzed by immunoblot (IB) analysis using anti-p65/RelA or anti-GST antibody. B, protein of myc-p65/RelA bound to GST-κB-Ras2 or T18N is shown on the graph. The amount of bound p65/RelA is shown as a percentage of the total amount of input p65/RelA. Error bars, S.D. (n = 3; *, p < 0.005).
FIGURE 8.
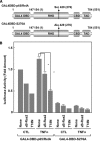
κB-Ras specifically inhibits the transcriptional activation of p65/RelA. A, schemes of GAL4DBD-p65/RelA and GAL4DBD-p65/RelA (S276A) were drawn. RHD, CBD, and TAD indicate the Rel-homology domain, CBP/p300-binding domain, and transcriptional activating domain, respectively. Numbers in parentheses mean the original position of amino acids in p65/RelA. B, HEK293T cells were transfected with pFR-luciferase plus the indicated combination of plasmids encoding GAL4DBD-p65/RelA, GAL4DBD-p65/RelA (S276A), FLAG-κB-Ras2, and/or T18N mutant. Cells were stimulated with TNFα. Cells were harvested and their luciferase activity was measured. CTL indicates unstimulated control. Error bars, S.D. (n = 3; *, p < 0.005).
FIGURE 9.
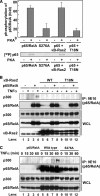
κB-Ras interrupts the interaction between p65/RelA and p300. A, effect of κB-Ras on PKA-catalyzed phosphorylation of p65/RelA in vitro. Recombinant proteins of p65/RelA or p65/RelA (S276A) were incubated with recombinant PKA in kinase reaction buffer including [γ-32P]ATP for 2 h at 37 °C. Phosphorylated samples were resolved by SDS-PAGE and analyzed by autoradiography. B, HEK293T cells were transfected with the indicated combination of plasmids encoding myc-p65/RelA, FLAG-κB-Ras2, and T18N mutant. Cells were stimulated with TNFα for 30 min, and their cell lysates were then used for immunoprecipitation (IP) with anti-Myc (9E10) antibody. Immunoprecipitates and whole cell lysates (WCL) were analyzed by immunoblotting with anti-p65/RelA, anti-p300, and anti-κB-Ras2 antibodies. CTL indicates transfection without κB-Ras2 or T18N. C, HEK293T cells expressing myc-p65/RelA or myc-p65/RelA (S276A) mutant were stimulated with 10 ng/ml TNFα for the indicated periods, and then their cell lysates were used for immunoprecipitation with anti-Myc (9E10) antibody. Immunoprecipitated samples and WCL were analyzed by immunoblotting with anti-p65/RelA and anti-p300 antibodies.
FIGURE 10.
Working hypothesis of κB-Ras-induced NF-κB inhibition. According to our current study, κB-Ras seems to inhibit NF-κB activation by interrupting the transcriptional activation of p65/RelA. The GDP-bound form of κB-Ras localized in cytosol mainly contributes to this suppressive mechanism.
Similar articles
- Akt stimulates the transactivation potential of the RelA/p65 Subunit of NF-kappa B through utilization of the Ikappa B kinase and activation of the mitogen-activated protein kinase p38.
Madrid LV, Mayo MW, Reuther JY, Baldwin AS Jr. Madrid LV, et al. J Biol Chem. 2001 Jun 1;276(22):18934-40. doi: 10.1074/jbc.M101103200. Epub 2001 Mar 20. J Biol Chem. 2001. PMID: 11259436 - Disruption of IkappaB kinase (IKK)-mediated RelA serine 536 phosphorylation sensitizes human multiple myeloma cells to histone deacetylase (HDAC) inhibitors.
Dai Y, Chen S, Wang L, Pei XY, Funk VL, Kramer LB, Dent P, Grant S. Dai Y, et al. J Biol Chem. 2011 Sep 30;286(39):34036-50. doi: 10.1074/jbc.M111.284216. Epub 2011 Aug 4. J Biol Chem. 2011. PMID: 21816815 Free PMC article. - Involvement of a novel Rac/RhoA guanosine triphosphatase-nuclear factor-kappaB inducing kinase signaling pathway mediating angiotensin II-induced RelA transactivation.
Choudhary S, Lu M, Cui R, Brasier AR. Choudhary S, et al. Mol Endocrinol. 2007 Sep;21(9):2203-17. doi: 10.1210/me.2006-0465. Epub 2007 Jun 26. Mol Endocrinol. 2007. PMID: 17595324 - The interferon-gamma-induced GTPase, mGBP-2, inhibits tumor necrosis factor alpha (TNF-alpha) induction of matrix metalloproteinase-9 (MMP-9) by inhibiting NF-kappaB and Rac protein.
Balasubramanian S, Fan M, Messmer-Blust AF, Yang CH, Trendel JA, Jeyaratnam JA, Pfeffer LM, Vestal DJ. Balasubramanian S, et al. J Biol Chem. 2011 Jun 3;286(22):20054-64. doi: 10.1074/jbc.M111.249326. Epub 2011 Apr 18. J Biol Chem. 2011. PMID: 21502320 Free PMC article. - Post-translational modifications of p65: state of the art.
Sun X, Cao S, Mao C, Sun F, Zhang X, Song Y. Sun X, et al. Front Cell Dev Biol. 2024 Jul 10;12:1417502. doi: 10.3389/fcell.2024.1417502. eCollection 2024. Front Cell Dev Biol. 2024. PMID: 39050887 Free PMC article. Review.
Cited by
- κB-Ras proteins regulate both NF-κB-dependent inflammation and Ral-dependent proliferation.
Oeckinghaus A, Postler TS, Rao P, Schmitt H, Schmitt V, Grinberg-Bleyer Y, Kühn LI, Gruber CW, Lienhard GE, Ghosh S. Oeckinghaus A, et al. Cell Rep. 2014 Sep 25;8(6):1793-1807. doi: 10.1016/j.celrep.2014.08.015. Epub 2014 Sep 15. Cell Rep. 2014. PMID: 25220458 Free PMC article. - MicroRNAs as the pivotal regulators of Temozolomide resistance in glioblastoma.
Palizkaran Yazdi M, Barjasteh A, Moghbeli M. Palizkaran Yazdi M, et al. Mol Brain. 2024 Jul 2;17(1):42. doi: 10.1186/s13041-024-01113-6. Mol Brain. 2024. PMID: 38956588 Free PMC article. Review. - miR-125b controls apoptosis and temozolomide resistance by targeting TNFAIP3 and NKIRAS2 in glioblastomas.
Haemmig S, Baumgartner U, Glück A, Zbinden S, Tschan MP, Kappeler A, Mariani L, Vajtai I, Vassella E. Haemmig S, et al. Cell Death Dis. 2014 Jun 5;5(6):e1279. doi: 10.1038/cddis.2014.245. Cell Death Dis. 2014. PMID: 24901050 Free PMC article. - Fibroblast growth factor 23 level modulates the hepatocyte's alpha-2-HS-glycoprotein transcription through the inflammatory pathway TNFα/NFκB.
Mattinzoli D, Li M, Castellano G, Ikehata M, Armelloni S, Elli FM, Molinari P, Tsugawa K, Alfieri CM, Messa P. Mattinzoli D, et al. Front Med (Lausanne). 2022 Dec 7;9:1038638. doi: 10.3389/fmed.2022.1038638. eCollection 2022. Front Med (Lausanne). 2022. PMID: 36569120 Free PMC article. - K15 promoter-driven enforced expression of NKIRAS exhibits tumor suppressive activity against the development of DMBA/TPA-induced skin tumors.
Tago K, Ohta S, Aoki-Ohmura C, Funakoshi-Tago M, Sashikawa M, Matsui T, Miyamoto Y, Wada T, Oshio T, Komine M, Matsugi J, Furukawa Y, Ohtsuki M, Yamauchi J, Yanagisawa K. Tago K, et al. Sci Rep. 2021 Oct 19;11(1):20658. doi: 10.1038/s41598-021-00200-1. Sci Rep. 2021. PMID: 34667224 Free PMC article.
References
- Lowy D. R., Willumsen B. M. (1993) Annu. Rev. Biochem. 62, 851–891 - PubMed
- Satoh T., Nakafuku M., Kaziro Y. (1992) J. Biol. Chem. 267, 24149–24152 - PubMed
- Satoh T., Minami Y., Kono T., Yamada K., Kawahara A., Taniguchi T., Kaziro Y. (1992) J. Biol. Chem. 267, 25423–25427 - PubMed
- Gibbs J. B., Marshall M. S., Scolnick E. M., Dixon R. A., Vogel U. S. (1990) J. Biol. Chem. 265, 20437–20442 - PubMed
Publication types
MeSH terms
Substances
LinkOut - more resources
Full Text Sources
Other Literature Sources
Molecular Biology Databases
Miscellaneous
