Facilitated transport and diffusion take distinct spatial routes through the nuclear pore complex - PubMed (original) (raw)
. 2010 Aug 15;123(Pt 16):2773-80.
doi: 10.1242/jcs.070730. Epub 2010 Jul 20.
Affiliations
- PMID: 20647373
- PMCID: PMC2915879
- DOI: 10.1242/jcs.070730
Facilitated transport and diffusion take distinct spatial routes through the nuclear pore complex
Jindriska Fiserova et al. J Cell Sci. 2010.
Abstract
Transport across the nuclear envelope is regulated by nuclear pore complexes (NPCs). Much is understood about the factors that shuttle and control the movement of cargos through the NPC, but less has been resolved about the translocation process itself. Various models predict how cargos move through the channel; however, direct observation of the process is missing. Therefore, we have developed methods to accurately determine cargo positions within the NPC. Cargos were instantly trapped in transit by high-pressure freezing, optimally preserved by low-temperature fixation and then localized by immunoelectron microscopy. A statistical modelling approach was used to identify cargo distribution. We found import cargos localized surprisingly close to the edge of the channel, whereas mRNA export factors were at the very centre of the NPC. On the other hand, diffusion of GFP was randomly distributed. Thus, we suggest that spatially distinguished pathways exist within the NPC. Deletion of specific FG domains of particular NPC proteins resulted in collapse of the peripheral localization and transport defects specific to a certain karyopherin pathway. This further confirms that constraints on the route of travel are biochemical rather than structural and that the peripheral route of travel is essential for facilitated import.
Figures
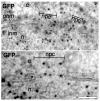
Fig. 1.
Import of Kap121 and Kap104 cargo proteins as viewed on thin sections of high-pressure frozen, freeze-substituted and immunogold-labelled yeast. Representative TEM micrographs of yeast transformed with markers for Kap104 (Nab2-NLS-GFP) and Kap121 (Spo12-NLS-GFP) import immunolabelled with polyclonal anti-GFP primary antibody and anti-rabbit secondary antibody conjugated to 5 nm gold. Note the preferentially peripheral locations of the gold particles. n, nucleus; c, cytoplasm; npc, nuclear pore complex; inm, inner nuclear membrane; onm, outer nuclear membrane; r, ribosome; pm, plasma membrane. Scale bars: 50 nm.
Fig. 2.
Gle1 and Dbp5 located preferentially in the centre of the NPC. Representative TEM micrographs of high-pressure frozen and freeze-substituted wild-type yeast immunolabelled with polyclonal anti-Gle1 and anti-Dbp5 primary antibodies and anti-rabbit secondary antibody conjugated to 5 nm gold. Note the preferentially central locations of the gold particles. Scale bars: 50 nm.
Fig. 3.
Diffusion of GFP takes a random route via the NPC. Representative TEM micrographs of high-pressure frozen and freeze-substituted yeast expressing unconjugated GFP immunolabelled with polyclonal anti-GFP primary antibody and anti-rabbit secondary antibody conjugated to 5 nm gold. The position of gold particles reflects the random location of GFP when diffusing through the NPC. Scale bars: 50 nm.
Fig. 4.
Schematic of the NPC demonstrating the principles of measurement and plotting. (A) TEM micrograph showing an NPC section (top), a schematic of the NPC section, and the relationship between the section and the three-dimensional proportions of the NPC channel (bottom). Sections are cut randomly through the NPC and immunogold labelled for TEM imaging. The distance of the gold particle (the particle chosen for analysis is marked by the white arrow and further represented by a black circle) from the NPC centre (y) and the half width of the sectioned NPC (l) are measured to determine the actual distance of the gold particle from the NPC centre (x). The grey central circle shows the position of the ‘central channel’ or ‘transporter’ with a radius (rc) of ~19 nm, as defined in Yang et al. (Yang et al., 1998) and Alber et al. (Alber et al., 2007). (B) Measured distances (l, y) are plotted for each data point to display the overall distribution of gold particles within the NPC. The dashed line marks the position of the NE and the grey area corresponds to the central area depicted in A. The black circle reflects the position of the gold particle in A.
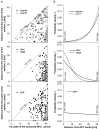
Fig. 5.
Distribution of the various translocation markers within the NPC. (A) Positions of gold particles within the NPC in relation to the NPC width show the actual position of the particles within the NPC. Each circle represents a gold particle (reflecting the location of Kap104 and Kap121 cargos, Gle1, Dbp5 and GFP) within the NPC section. The dashed line delineates the position of the NPC edge and the grey area marks the NPC central area defined by radius 19 nm (Yang et al., 1998). (B) The best-fitting PDFs describing the position of cargos, Gle1, Dbp5 and GFP in relation to the horizontal distance (x) from the NPC centre. Whereas the best-fitting PDFs for both Kap121 and Kap104 cargos predicted an increasing likelihood of the Kap104 and Kap121 cargos being transported close to the NPC edge (top graph), the Gle1 and Dbp5 locations show the opposite trend (middle graph). The bottom graph shows the best fitting PDF for GFP. An asterisk indicates that this PDF is consistent with a uniform distribution. For Kap121 cargo _n_=130, for Kap104 cargo _n_=60, for Gle1 _n_=117, for Dbp5 _n_=33 and for GFP _n_=136.
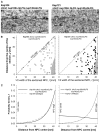
Fig. 6.
In the Δ**NΔC nup100ΔGLFG nup145ΔGLFG mutant, Kap121-dependent transport is affected.** (A) Representative micrographs of Kap104 and Kap121 locations within the mutant NPC. (B) Graphs showing the positions of all analysed gold particles (reflecting the localisation of transported Kap104 and Kap121 cargos) in the mutant strain. The dashed line delineates the position of the NPC edge; the grey area marks the NPC central area. (C) The best-fitting models of Kap121 and Kap104 cargos within the NPC in the mutant strain (solid line) compared to the wild type. For wild-type data, see details in Fig. 3. An asterisk indicates that this PDF is consistent with a uniform distribution. For Δ_N_Δ_C nup100_Δ_GLFG nup145_Δ_GLFG_ mutant strain, Kap121 cargo _n_=77; Kap104 cargo _n_=76.
Similar articles
- Nuclear mRNA export requires specific FG nucleoporins for translocation through the nuclear pore complex.
Terry LJ, Wente SR. Terry LJ, et al. J Cell Biol. 2007 Sep 24;178(7):1121-32. doi: 10.1083/jcb.200704174. Epub 2007 Sep 17. J Cell Biol. 2007. PMID: 17875746 Free PMC article. - Long unfolded linkers facilitate membrane protein import through the nuclear pore complex.
Meinema AC, Laba JK, Hapsari RA, Otten R, Mulder FA, Kralt A, van den Bogaart G, Lusk CP, Poolman B, Veenhoff LM. Meinema AC, et al. Science. 2011 Jul 1;333(6038):90-3. doi: 10.1126/science.1205741. Epub 2011 Jun 9. Science. 2011. PMID: 21659568 - Nuclear pore complex: biochemistry and biophysics of nucleocytoplasmic transport in health and disease.
Jamali T, Jamali Y, Mehrbod M, Mofrad MR. Jamali T, et al. Int Rev Cell Mol Biol. 2011;287:233-86. doi: 10.1016/B978-0-12-386043-9.00006-2. Int Rev Cell Mol Biol. 2011. PMID: 21414590 Review. - Into the basket and beyond: the journey of mRNA through the nuclear pore complex.
Ashkenazy-Titelman A, Shav-Tal Y, Kehlenbach RH. Ashkenazy-Titelman A, et al. Biochem J. 2020 Jan 17;477(1):23-44. doi: 10.1042/BCJ20190132. Biochem J. 2020. PMID: 31913454 Review. - ER membrane-bending proteins are necessary for de novo nuclear pore formation.
Dawson TR, Lazarus MD, Hetzer MW, Wente SR. Dawson TR, et al. J Cell Biol. 2009 Mar 9;184(5):659-75. doi: 10.1083/jcb.200806174. J Cell Biol. 2009. PMID: 19273614 Free PMC article.
Cited by
- Distinct, but not completely separate spatial transport routes in the nuclear pore complex.
Yang W. Yang W. Nucleus. 2013 May-Jun;4(3):166-75. doi: 10.4161/nucl.24874. Epub 2013 May 1. Nucleus. 2013. PMID: 23669120 Free PMC article. Review. - Single molecule fluorescence approaches shed light on intracellular RNAs.
Pitchiaya S, Heinicke LA, Custer TC, Walter NG. Pitchiaya S, et al. Chem Rev. 2014 Mar 26;114(6):3224-65. doi: 10.1021/cr400496q. Epub 2014 Jan 8. Chem Rev. 2014. PMID: 24417544 Free PMC article. Review. No abstract available. - Nucleoporin FG domains facilitate mRNP remodeling at the cytoplasmic face of the nuclear pore complex.
Adams RL, Terry LJ, Wente SR. Adams RL, et al. Genetics. 2014 Aug;197(4):1213-24. doi: 10.1534/genetics.114.164012. Epub 2014 Jun 14. Genetics. 2014. PMID: 24931410 Free PMC article. - Size-dependent leak of soluble and membrane proteins through the yeast nuclear pore complex.
Popken P, Ghavami A, Onck PR, Poolman B, Veenhoff LM. Popken P, et al. Mol Biol Cell. 2015 Apr 1;26(7):1386-94. doi: 10.1091/mbc.E14-07-1175. Epub 2015 Jan 28. Mol Biol Cell. 2015. PMID: 25631821 Free PMC article. - Nanoscale mechanism of molecular transport through the nuclear pore complex as studied by scanning electrochemical microscopy.
Kim J, Izadyar A, Nioradze N, Amemiya S. Kim J, et al. J Am Chem Soc. 2013 Feb 13;135(6):2321-9. doi: 10.1021/ja311080j. Epub 2013 Jan 30. J Am Chem Soc. 2013. PMID: 23320434 Free PMC article.
References
- Alber F., Dokudovskaya S., Veenhoff L. M., Zhang W., Kipper J., Devos D., Suprapto A., Karni-Schmidt O., Williams R., Chait B. T., et al. (2007). The molecular architecture of the nuclear pore complex. Nature 450, 695-701 - PubMed
- Alcazar-Roman A. R., Tran E. J., Guo S., Wente S. R. (2006). Inositol hexakisphosphate and Gle1 activate the DEAD-box protein Dbp5 for nuclear mRNA export. Nat. Cell Biol. 8, 711-716 - PubMed
- Allen T. D., Cronshaw J. M., Bagley S., Kiseleva E., Goldberg M. W. (2000). The nuclear pore complex: mediator of translocation between nucleus and cytoplasm. J. Cell Sci. 113, 1651-1659 - PubMed
- Allen N. P., Patel S. S., Huang L., Chalkley R. J., Burlingame A., Lutzmann M., Hurt E. C., Rexach M. (2002). Deciphering networks of protein interactions at the nuclear pore complex. Mol. Cell Proteomics 1, 930-946 - PubMed
Publication types
MeSH terms
Substances
Grants and funding
- R01 GM051219/GM/NIGMS NIH HHS/United States
- R37 GM051219/GM/NIGMS NIH HHS/United States
- BB/E015735/1/BB_/Biotechnology and Biological Sciences Research Council/United Kingdom
LinkOut - more resources
Full Text Sources
Molecular Biology Databases


