Essential regulation of cell bioenergetics by constitutive InsP3 receptor Ca2+ transfer to mitochondria - PubMed (original) (raw)
. 2010 Jul 23;142(2):270-83.
doi: 10.1016/j.cell.2010.06.007.
Russell A Miller, Ian Smith, Thi Bui, Jordi Molgó, Marioly Müller, Horia Vais, King-Ho Cheung, Jun Yang, Ian Parker, Craig B Thompson, Morris J Birnbaum, Kenneth R Hallows, J Kevin Foskett
Affiliations
- PMID: 20655468
- PMCID: PMC2911450
- DOI: 10.1016/j.cell.2010.06.007
Essential regulation of cell bioenergetics by constitutive InsP3 receptor Ca2+ transfer to mitochondria
César Cárdenas et al. Cell. 2010.
Abstract
Mechanisms that regulate cellular metabolism are a fundamental requirement of all cells. Most eukaryotic cells rely on aerobic mitochondrial metabolism to generate ATP. Nevertheless, regulation of mitochondrial activity is incompletely understood. Here we identified an unexpected and essential role for constitutive InsP(3)R-mediated Ca(2+) release in maintaining cellular bioenergetics. Macroautophagy provides eukaryotes with an adaptive response to nutrient deprivation that prolongs survival. Constitutive InsP(3)R Ca(2+) signaling is required for macroautophagy suppression in cells in nutrient-replete media. In its absence, cells become metabolically compromised due to diminished mitochondrial Ca(2+) uptake. Mitochondrial uptake of InsP(3)R-released Ca(2+) is fundamentally required to provide optimal bioenergetics by providing sufficient reducing equivalents to support oxidative phosphorylation. Absence of this Ca(2+) transfer results in enhanced phosphorylation of pyruvate dehydrogenase and activation of AMPK, which activates prosurvival macroautophagy. Thus, constitutive InsP(3)R Ca(2+) release to mitochondria is an essential cellular process that is required for efficient mitochondrial respiration and maintenance of normal cell bioenergetics.
Copyright 2010 Elsevier Inc. All rights reserved.
Figures
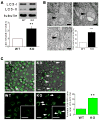
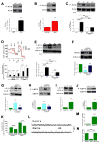
Figure 1. InsP3R Deficient Cells Have Elevated Autophagy in Nutrient Rich Conditions
(A) Western blot of LC3 or tubulin in WT and DT40-KO cells (top) and quantification of LC3-II/(LC3-I + LC3-II) (bottom) expressed as fold increase over WT levels (n = 8). (B) TEM of DT40-KO cells showing autophagosomes (AV, arrows), and summary of cell profiles containing AV. 400 profiles counted in 4 experiments. Bars, 50 nm. (C) Confocal images of GFP-LC3 in WT and KO DT40 cells (left and middle panels). Arrows show LC3 puncta (900 cells from 3 experiments with 15 random fields/experiment). *** p < 0.001, ** p < 0.01; Bar, 10 μm. See also Figure S1.
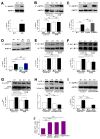
Figure 2. InsP3R Dependence of Autophagy Suppression in Nutrient Rich Conditions
(A) XeB (2 μM for 1 h) induces autophagy in WT DT40 cells to levels observed in DT40-KO cells (n = 6). (B) TEM of WT (left) and KO (right) cells showing AV (arrows and insets) after 1 h incubation with 2 μM XeB. Bars, 500 nm. Bottom panel summary of 100 cells per experiment counted from 15 fields (n = 3). (C) Current recordings in isolated nuclei from DT40-KO cells expressing D2550A-InsP3R-3. Upper: typical gating, arrow represents closed channel current level. Bottom: currents during voltage ramps in control solution (black) and in presence of 10 mM luminal Ca2+ (red). Lack of normal shift in reversal potential indicates absence of Ca2+ permeability. (D) Expression of InsP3R-3, but not Ca2+-impermeable D2550A-InsP3R-3, suppresses autophagy in KO cells (n = 3). (E) TEM of AV (arrows) in cells stably-transfected with D2550A-InsP3R-3. Bar = 500 nm. (F) RyR-2 expression fails to suppress autophagy in KO cells (n = 3). *** p < 0.001; ** p < 0.01; NS not significant. See also Figures S2, S3 and S4.
Figure 3. Lack of InsP3R Ca2+ Release Activity Actives Pro-Survival Mechanisms
(A and B) Glucose (A) and glutamine (B) consumption measured daily in DT40 cells. (C) Cytochalasin B (Cyt B)-sensitive deoxyglucose uptake by WT and KO cells (n = 3). (D) Effects of autophagy inhibition by 3MA in nutrient-rich media on viability (PI-negative cells) of WT and KO cells after 24 hr (n = 3). (E and F) Survival of WT and KO cells in starvation conditions (Hank’s) in absence (E) and presence (F) of 3MA (n = 3). (G) Death (PI-positive cells) of Atg5-deficient primary hepatocytes induced by XeB (n = 3). (H) Recovery of WT and KO cells after 24 hr starvation. Same number of cells seeded in complete medium (n = 3). Error bars shown when bigger than points. *** p < 0.001, ** p < 0.01.
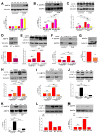
Figure 4. Pro-Survival Autophagy Induced By Lack of InsP3R Ca2+ Signaling is Associated with Activation of AMPK but not mTOR
(A) DT40-KO have higher levels of P-AMPK than DT40-WT cells. P-AMPK/AMPK expressed as fold increase over WT levels (n = 8). (B) XeB (2 μM for 1 h) increases P-AMPK in WT cells to levels observed in KO cells (n = 6). (C) InsP3R-3 but not Ca2+-impermeant D2550A-InsP3R-3 reduces high P-AMPK in KO cells to control (WT) levels (n = 3). (D) Expression of RyR-2 fails to reduce P-AMPK in KO cells (n = 3). (E) mTOR phosphorylation is similar in KO and WT cells and is unaffected by XeB (2 μM for 2 h). P-mTOR/mTOR levels expressed as fold increase over WT levels (n = 5). (F and G) Phosphorylation of mTOR substrates 4E-BP1 and p70S6K in KO and WT cells treated or not with 2 μM XeB for 2h. P-4E-BP1/4E-BP1 or P-p70S6K/p70S6K levels expressed as fold increase over WT levels (n = 5). (H and I) AMPK inhibition by compound C (CC; 2.5 μM for 1 hr) represses constitutive autophagy and elevated P-AMPK observed in KO cells (n = 5). (J) XeB (2 μM, 1 hr) increases AMP/ATP ratio in hepatocytes. AMP/ATP ratio expressed as average fold increase (mean ± S.E, n = 3) over untreated conditions. *p < 0.05, ** p < 0.01,*** p < 0.001, NS not significant. See also Figure S3.
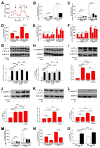
Figure 5. Pro-Survival Autophagy Induced By Lack of InsP3R Ca2+ Signaling is Mediated by AMPK
(A) α1-AMPK expression in HEK-293 cells stably expressing DOX-inducible WT or dominant negative (DN) α1-AMPK in presence or absence of DOX. Cells transfected with empty vector (EV) used as control. AMPK/tubulin expressed as fold increase over basal levels (DOX untreated) (n= 6). (B and C) XeB (2 μM for 1 h) failed to trigger either autophagy or AMPK phosphorylation in cells expressing DN-AMPK. Over-expression of WT α1-AMPK increased autophagy (n = 6). (D) α1-AMPK levels in HEK cells transiently transfected with α1-AMPK or irrelevant (NT) siRNA (n = 3). (E and F) XeB fails to induce autophagy or P-AMPK in cells transiently transfected with α1-AMPK siRNA (n = 3). (G) HEK-293 cells stably expressing inducible α1-AMPK shRNA were exposed to DOX for 72 hr (n = 3). (H and I) XeB fails to induce autophagy and P-AMPK in cells expressing inducible α1-AMPK shRNA (n = 3). (J – M) Treatment of DT40-KO (J and K) and HEK-293 (L and M) cells with methyl-pyruvate (MP; 5 μM for 1 hr) reduced autophagy and AMPK hyper-phosphorylation (n = 3). *p < 0.05, ** p < 0.01, *** p < 0.001, NS, not significant. See also Figures S3 and S4.
Figure 6. Lack of InsP3R Ca2+ Signaling and Inhibition of Mitochondrial Ca2+ Uptake Are in the Same Pathway that Regulates Bioenergetics and Autophagy
(A) Oxygen consumption rates (OCR) in WT (red) and KO (black) DT40 cells exposed sequentially to (a) oligomycin, (b) FCCP and (c) rotenone plus myzothiazol. (B) Basal and maximal OCR in WT and KO DT40 cells (n =3). (C and D) Basal and maximal OCR in DT40 and HEK-293 cells treated or not with XeB (2 μM for 1 hr) (n = 3). (E – F) The Ca2+ ionophore ionomycin (100 nM) reversed inhibitory effects of XeB (E) and Ru360 (F) on OCR. (G – J) Effects of inhibition of mitochondrial Ca2+ uptake by Ru360 (10 μM for 1 h) in absence or presence of XeB on autophagy and P-AMPK in DT40 (G and H) and HEK-293 (I and J) cells (n = 3). (K and L) Effects of methyl-pyruvate (MP, 5 μM) on autophagy and P-AMPK evoked by 10 μM Ru360 in HEK-293 cells (n = 3). (M and N) Effects of mitochondrial Ca2+ uptake inhibition by Ru360 on basal and maximum OCR in DT40 (M) and HEK-293 (N) cells (n = 3). (O) Lactate generation in WT and KO cells after 24h in normal media (n = 3) *** p < 0.001, NS not significant. See also Figure S4.
Figure 7. Normal Growth Medium Supports Constitutive InsP3R Ca2+ Release
(A and B) DT40-KO cells and XeB-treated HEK-293 cells have higher levels of phospho-PDH (n = 3). (C – E) DCA treatment normalizes PDH hyper-phosphorylation (C; 2 mM for 1h), enhances OCR (D; added acutely at “a”) and suppress autophagy (E; 2 mM for 1h) in KO cells to WT levels. (n = 3). (F) Effect of transient transfection (48 h) with specific or irrelevant (NT) siRNA on InsP3R-1 expression in SH-SY5Y cells. InsP3R-1/tubulin (n = 3) expressed relative to basal levels. (G – J) Effects of InsP3R-1 knockdown (G and H) or XeB (10 μM, 1 h) (I and J) on autophagy and P-AMPK in SH-SY5Y cells (n=3). (K) Effects of InsP3R-1 knockdown on basal and maximum OCR in SH-SY5Y cells (n=3). (L) Representative fluorescence recordings of Ca2+ release events in unstimulated SH-SY5Y cells in either Hank’s solution or normal culture media. (M) Quantification of Ca2+ release events in SH-SY5Y cells exposed either to Hank’s or normal media (n=3 experiments). (N) Effects of XeB (10 μM for 30 min) on spontaneous Ca2+ release events recorded in SH-SY5Y cells in normal media (n=3 experiments). **p < 0.01 ***p < 0.001. See also Figure S5 and Video S1.
Comment in
- Calcium and energy: making the cake and eating it too?
Green DR, Wang R. Green DR, et al. Cell. 2010 Jul 23;142(2):200-2. doi: 10.1016/j.cell.2010.07.007. Cell. 2010. PMID: 20655464
Similar articles
- Mitochondrial Ca(2+) signals in autophagy.
Cárdenas C, Foskett JK. Cárdenas C, et al. Cell Calcium. 2012 Jul;52(1):44-51. doi: 10.1016/j.ceca.2012.03.001. Epub 2012 Mar 28. Cell Calcium. 2012. PMID: 22459281 Free PMC article. Review. - Mitochondrial Ca2+ uptake increases Ca2+ release from inositol 1,4,5-trisphosphate receptor clusters in smooth muscle cells.
Olson ML, Chalmers S, McCarron JG. Olson ML, et al. J Biol Chem. 2010 Jan 15;285(3):2040-50. doi: 10.1074/jbc.M109.027094. Epub 2009 Nov 4. J Biol Chem. 2010. PMID: 19889626 Free PMC article. - IP3 receptor-mediated Ca2+ release from acidocalcisomes regulates mitochondrial bioenergetics and prevents autophagy in Trypanosoma cruzi.
Chiurillo MA, Lander N, Vercesi AE, Docampo R. Chiurillo MA, et al. Cell Calcium. 2020 Dec;92:102284. doi: 10.1016/j.ceca.2020.102284. Epub 2020 Sep 2. Cell Calcium. 2020. PMID: 32947181 - Phosphorylation of inositol 1,4,5-trisphosphate receptors by protein kinase B/Akt inhibits Ca2+ release and apoptosis.
Szado T, Vanderheyden V, Parys JB, De Smedt H, Rietdorf K, Kotelevets L, Chastre E, Khan F, Landegren U, Söderberg O, Bootman MD, Roderick HL. Szado T, et al. Proc Natl Acad Sci U S A. 2008 Feb 19;105(7):2427-32. doi: 10.1073/pnas.0711324105. Epub 2008 Feb 4. Proc Natl Acad Sci U S A. 2008. PMID: 18250332 Free PMC article. - Remodeling of Ca2+ signaling in cancer: Regulation of inositol 1,4,5-trisphosphate receptors through oncogenes and tumor suppressors.
Ando H, Kawaai K, Bonneau B, Mikoshiba K. Ando H, et al. Adv Biol Regul. 2018 May;68:64-76. doi: 10.1016/j.jbior.2017.12.001. Epub 2017 Dec 20. Adv Biol Regul. 2018. PMID: 29287955 Review.
Cited by
- Trypanosoma cruzi Letm1 is involved in mitochondrial Ca2+ transport, and is essential for replication, differentiation, and host cell invasion.
Dos Santos GRR, Rezende Leite AC, Lander N, Chiurillo MA, Vercesi AE, Docampo R. Dos Santos GRR, et al. FASEB J. 2021 Jul;35(7):e21685. doi: 10.1096/fj.202100120RR. FASEB J. 2021. PMID: 34085343 Free PMC article. - Therapeutic targeting of autophagy in neurodegenerative and infectious diseases.
Rubinsztein DC, Bento CF, Deretic V. Rubinsztein DC, et al. J Exp Med. 2015 Jun 29;212(7):979-90. doi: 10.1084/jem.20150956. Epub 2015 Jun 22. J Exp Med. 2015. PMID: 26101267 Free PMC article. Review. - PKD2/polycystin-2 induces autophagy by forming a complex with BECN1.
Peña-Oyarzun D, Rodriguez-Peña M, Burgos-Bravo F, Vergara A, Kretschmar C, Sotomayor-Flores C, Ramirez-Sarmiento CA, De Smedt H, Reyes M, Perez W, Torres VA, Morselli E, Altamirano F, Wilson CAM, Hill JA, Lavandero S, Criollo A. Peña-Oyarzun D, et al. Autophagy. 2021 Jul;17(7):1714-1728. doi: 10.1080/15548627.2020.1782035. Epub 2020 Jun 30. Autophagy. 2021. PMID: 32543276 Free PMC article. - The mitochondrial calcium uniporter controls skeletal muscle trophism in vivo.
Mammucari C, Gherardi G, Zamparo I, Raffaello A, Boncompagni S, Chemello F, Cagnin S, Braga A, Zanin S, Pallafacchina G, Zentilin L, Sandri M, De Stefani D, Protasi F, Lanfranchi G, Rizzuto R. Mammucari C, et al. Cell Rep. 2015 Mar 3;10(8):1269-79. doi: 10.1016/j.celrep.2015.01.056. Epub 2015 Feb 26. Cell Rep. 2015. PMID: 25732818 Free PMC article. - SARS-CoV-2 Viroporin E Induces Ca2+ Release and Neuron Cell Death in Primary Cultures of Rat Hippocampal Cells Aged In Vitro.
López-Vázquez S, Villalobos C, Núñez L. López-Vázquez S, et al. Int J Mol Sci. 2024 Jun 7;25(12):6304. doi: 10.3390/ijms25126304. Int J Mol Sci. 2024. PMID: 38928009 Free PMC article.
References
- Balaban RS. Regulation of oxidative phosphorylation in the mammalian cell. The American journal of physiology. 1990;258:C377–389. - PubMed
- Balaban RS, Nemoto S, Finkel T. Mitochondria, oxidants, and aging. Cell. 2005;120:483–495. - PubMed
- Criollo A, Maiuri MC, Tasdemir E, Vitale I, Fiebig AA, Andrews D, Molgó J, Diaz J, Lavandero S, Harper F, et al. Regulation of autophagy by the inositol trisphosphate receptor. Cell Death Differ. 2007;14:1029–1039. - PubMed
Publication types
MeSH terms
Substances
Grants and funding
- R01 GM048071/GM/NIGMS NIH HHS/United States
- R01 DK075048/DK/NIDDK NIH HHS/United States
- R01 GM065830/GM/NIGMS NIH HHS/United States
- F32 DK079572/DK/NIDDK NIH HHS/United States
- R01 CA099179/CA/NCI NIH HHS/United States
- R01 MH059937-10/MH/NIMH NIH HHS/United States
- R01 MH059937-11/MH/NIMH NIH HHS/United States
- R01 GM056328-10/GM/NIGMS NIH HHS/United States
- R01 CA092660/CA/NCI NIH HHS/United States
- R01 GM056328-11/GM/NIGMS NIH HHS/United States
- R01 GM056328-09/GM/NIGMS NIH HHS/United States
- MH059937/MH/NIMH NIH HHS/United States
- GM/DK56328/DK/NIDDK NIH HHS/United States
- R01 DK075048-03/DK/NIDDK NIH HHS/United States
- R37 GM048071/GM/NIGMS NIH HHS/United States
- R01 DK075048-01A1/DK/NIDDK NIH HHS/United States
- R01 GM056328-12/GM/NIGMS NIH HHS/United States
- GM065830/GM/NIGMS NIH HHS/United States
- R01 DK075048-04/DK/NIDDK NIH HHS/United States
- GM48071/GM/NIGMS NIH HHS/United States
- R01 MH059937/MH/NIMH NIH HHS/United States
- CA092660/CA/NCI NIH HHS/United States
- DK079572/DK/NIDDK NIH HHS/United States
- DK075048/DK/NIDDK NIH HHS/United States
- R01 GM056328/GM/NIGMS NIH HHS/United States
- CA099179/CA/NCI NIH HHS/United States
- R01 MH059937-12/MH/NIMH NIH HHS/United States
- R01 DK075048-05/DK/NIDDK NIH HHS/United States
- P30-DK19535/DK/NIDDK NIH HHS/United States
- R01 DK075048-02/DK/NIDDK NIH HHS/United States
- R01 DK056328/DK/NIDDK NIH HHS/United States
LinkOut - more resources
Full Text Sources
Other Literature Sources
Miscellaneous
