Cannabinoid receptor-dependent and -independent anti-proliferative effects of omega-3 ethanolamides in androgen receptor-positive and -negative prostate cancer cell lines - PubMed (original) (raw)
Cannabinoid receptor-dependent and -independent anti-proliferative effects of omega-3 ethanolamides in androgen receptor-positive and -negative prostate cancer cell lines
Iain Brown et al. Carcinogenesis. 2010 Sep.
Abstract
The omega-3 fatty acid ethanolamides, docosahexaenoyl ethanolamide (DHEA) and eicosapentaenoyl ethanolamide (EPEA), displayed greater anti-proliferative potency than their parent omega-3 fatty acids, docosahexaenoic acid (DHA) and eicosapentaenoic acid (EPA), in LNCaP and PC3 prostate cancer cells. DHEA and EPEA activated cannabinoid CB(1) and CB(2) receptors in vitro with significant potency, suggesting that they are endocannabinoids. Both LNCaP and PC3 cells expressed CB(1) and CB(2) receptors, and the CB(1)- and CB(2)-selective antagonists, AM281 and AM630, administered separately or together, reduced the anti-proliferative potencies of EPEA and EPA but not of DHEA or DHA in PC3 cells and of EPA but not of EPEA, DHEA or DHA in LNCaP cells. Even so, EPEA and EPA may not have inhibited PC3 or LNCaP cell proliferation via cannabinoid receptors since the anti-proliferative potency of EPEA was well below the potency it displayed as a CB(1) or CB(2) receptor agonist. Indeed, these receptors may mediate a protective effect because the anti-proliferative potency of DHEA in LNCaP and PC3 cells was increased by separate or combined administration of AM281 and AM630. The anandamide-metabolizing enzyme, fatty acid amide hydrolase (FAAH), was highly expressed in LNCaP but not PC3 cells. Evidence was obtained that FAAH metabolizes EPEA and DHEA and that the anti-proliferative potencies of these ethanolamides in LNCaP cells can be enhanced by inhibiting this enzyme. Our findings suggest that the expression of cannabinoid receptors and of FAAH in some tumour cells could well influence the effectiveness of DHA and EPA or their ethanolamide derivatives as anticancer agents.
Figures
Fig. 1.
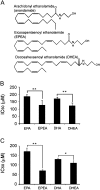
Structure of EPA and DHA ethanolamides and their effects on cell viability. (A) Chemical structure of EPEA and DHEA compared with anandamide. (B) IC50 values as determined from MTT assays in LNCaP and (C) PC3 cells treated with either fatty acids (EPA and DHA) or ethanolamides (EPEA or DHEA) for 24 h. Error bars represent standard error of mean. *P ≤ 0.05, **P ≤ 0.01 (n = 3).
Fig. 2.
(A and B) Cannabinoid receptor expression. A graphical representation of expression as a percentage relative to β-actin internal control and also a representative example of western blotting. (A) CB1 receptor protein expression in PC3 (PC) and LNCaP (LN) cells. β-Actin used as loading control and positive control is rat cerebellum lysate (+). (B) CB2 expression in PC3 (PC) and LNCaP (LN) cells. β-Actin used as loading control and positive control is HL-60 cells (+). Error bars represent standard error of mean (n = 3). (C and D) Effect of inhibiting cannabinoid receptors in (C) LNCaP cells and (D) PC3 cells. IC50 values as determined from MTT assays. (AM281, a CB1-selective antagonist; AM630, a CB2-selective antagonist; Mix, mixture of both antagonists; FA, fatty acid; EA, ethanolamide). AM251 and AM630 were each administered at a concentration of 1 μM. Error bars represent standard error of mean. *P ≤ 0.05, **P ≤ 0.01 comparing cells treated with a FA or EA alone and cells also treated with AM281 or AM630 or with both AM281 and AM630 (Mix), (n = 3–5).
Fig. 3.
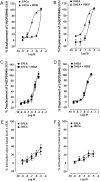
Functional activity of ethanolamides. (A and D) Displacement of [3H]CP55940 by (A) EPEA and (B) DHEA from specific binding sites on MF1 mouse whole brain membranes (n = 4) and displacement of [3H]CP55940 by (C) EPEA and (D) DHEA from specific binding sites on CHO-hCB2 cell membranes (n = 8). Each experiment has been performed in the absence and presence of 100 μM PMSF. Each symbol represents the mean percent displacement ± standard error of the mean. Mean _K_i values with 95% confidence limits shown in brackets are shown in Table II. (E and F) Mean log concentration–response curves of EPEA and DHEA. Each symbol represents the mean percentage change in binding of [35S]GTPγS to (E) MF1 mouse brain and (F) CHO-hCB2 cell (B) membranes ± standard error of the mean. Mean EC50 and _E_max values are shown in Table II.
Fig. 4.
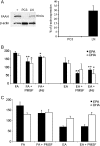
Role of FAAH in LNCaP and PC3 cells. (A) A representative example of western blotting. β-Actin used as internal loading control. Positive control (+) is UM-84 cell line. Combined protein expression data shown as bar chart indicating ratio of expression of protein of interest to β-actin ± standard error of the mean. (B) Effect of inhibiting FAAH with PMSF or JNJ101660 (JNJ), in LNCaP, cells and (C) inhibition with PMSF in PC3 cells. (PMSF; JNJ, selective FAAH inhibitor, JNJ10660. FA, fatty acid, EA, ethanolamide). Error bars represent standard error of the mean. *P ≤ 0.05, **P ≤ 0.01 comparing cells treated with either FA only or EA only, against those treated with FAAH inhibitors.
References
- Shaikh IA, et al. Docosahexaenoic acid enhances the efficacy of docetaxel in prostate cancer cells by modulation of apoptosis: the role of genes associated with the NF-kappaB pathway. Prostate. 2008;68:1635–1646. - PubMed
- Howlett AC. The cannabinoid receptors. Prostaglandins Other Lipid Mediat. 2002;68-69:619–631. - PubMed
Publication types
MeSH terms
Substances
LinkOut - more resources
Full Text Sources
Other Literature Sources
Medical
Research Materials


