Autophagy inhibition and antimalarials promote cell death in gastrointestinal stromal tumor (GIST) - PubMed (original) (raw)
. 2010 Aug 10;107(32):14333-8.
doi: 10.1073/pnas.1000248107. Epub 2010 Jul 26.
Srirupa Roy, Alexander J F Lazar, Wei-Lien Wang, John C McAuliffe, David Reynoso, James McMahon, Takahiro Taguchi, Giuseppe Floris, Maria Debiec-Rychter, Patrick Schoffski, Jonathan A Trent, Jayanta Debnath, Brian P Rubin
Affiliations
- PMID: 20660757
- PMCID: PMC2922542
- DOI: 10.1073/pnas.1000248107
Autophagy inhibition and antimalarials promote cell death in gastrointestinal stromal tumor (GIST)
Anu Gupta et al. Proc Natl Acad Sci U S A. 2010.
Abstract
Although gastrointestinal stromal tumors (GISTs) harboring activating KIT or platelet-derived growth factor receptor A (PDGFRA) mutations respond to treatment with targeted KIT/PDGFRA inhibitors such as imatinib mesylate, these treatments are rarely curative. Most often, a sizeable tumor cell subpopulation survives and remains quiescent for years, eventually resulting in acquired resistance and treatment failure. Here, we report that imatinib induces autophagy as a survival pathway in quiescent GIST cells. Inhibiting autophagy, using RNAi-mediated silencing of autophagy regulators (ATGs) or antimalarial lysosomotrophic agents, promotes the death of GIST cells both in vitro and in vivo. Thus, combining imatinib with autophagy inhibition represents a potentially valuable strategy to promote GIST cytotoxicity and to diminish both cellular quiescence and acquired resistance in GIST patients.
Conflict of interest statement
Conflict of interest statement: B.P.R. is a member of the Novarits Speakers Bureau, is a consultant for Novartis and has designed educational material for Novartis. A.J.F.L. is a member of the Novartis Speakers Bureau. J.A.T. is a member of the Novartis Speakers Bureau and participates in Novartis-sponsored research and clinical trials. P.S. has received a commercial research grant from Novartis. M.D.-R. has received honoraria from Novartis.
Figures
Fig. 1.
Imatinib induces reversible quiescence in GIST cells. Experiments were performed in imatinib-sensitive GIST-T1 and GIST882 and imatinib-resistant GIST-T1-R cell lines. (A) Cells were grown in the absence or presence of imatinib for the indicated times, lysed, and immunobloted with antibodies to KIT, pKIT (Y721), and β-actin. (B) Cell proliferation was measured after treatment with the indicated concentrations of imatinib for 72 h. (C) Cell-cycle analysis by flow cytometry after treatment with 1 μM imatinib for 6 d and then 2 d after removal of imatinib. (D) GIST-T1 were grown in the absence (control) or presence of 1 μM imatinib for the indicated times, lysed, and immunoblotted with antibodies to KIT, pKIT (Y721), pEIF2α (Ser51), eIF2α, pS6 (Ser235/236), S6, p27, and β-actin. (E) 2-NBDG uptake measured in GIST-T1 after incubation in imatinib at the indicated doses for 24 h. During washout, cells were incubated in 1 μM imatinib for 24 h, followed by withdrawal of imatinib for 24 h.
Fig. 2.
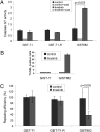
Imatinib induces variable amounts of apoptosis and cell death in different GIST cell lines. (A) Cells were grown for 72 h with or without 1 μM imatinib and assayed for caspase 3/7 activity. (B) Percentage of TUNEL-positive cells for GIST-T1 and GIST882. (C) Clonogenic replating efficiency of cells after treatment with or without 1 μM imatinib for 72 h. Results are the mean ± SD from three independent experiments.
Fig. 3.
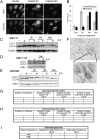
Imatinib induces autophagy in vitro and in vivo. (A) Representative images of GFP and mCherry fluorescent puncta in GIST-T1 cells expressing mCherry-GFP-LC3 grown in complete media with 1 μM imatinib for the indicated times. (B) Quantification of GFP/mCherry double-positive and mCherry single-positive puncta per cell in control or cells treated with 1 μM imatinib for the indicated times. GIST-T1 (C), GIST-T1-R (D), and GIST882 (E) were treated with 1 μM imatinib for the indicated times, lysed, and immunoblotted with antibodies to LC3 or tubulin or actin. (F) α-LC3 immunohistochemistry from a representative spindle cell gastric GIST from a patient treated with neoadjuvant imatinib for 7 d. Note the punctate staining pattern (blowup) consistent with the induction of autophagosomes. (G) Table summarizing results from imatinib-sensitive GISTs. (H) Table summarizing results from imatinib-resistant GISTs. (I) Table summarizing results from CC-3 immunohistochemistry of imatinib-sensitive GISTs.
Fig. 4.
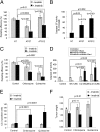
ATG depletion and antimalarial lysosomal inhibitors promote cell death in imatinib-treated GIST cells. (A) Clonogenic replating efficiency of cells after 72 h of treatment with or without 1 μM imatinib in ATG7- or ATG12-depleted cells. (B) Caspase 3/7 activity was measured in ATG7- or ATG12-depleted cell lines with administration of 1 μM imatinib for 72 h. (C) Clonogenic replating efficiency of GIST-T1 cells after 48 h of treatment with 1 μM imatinib, 50 μM chloroquine, or 3 μM quinacrine and each autophagy inhibitor in combination with imatinib. (D) Caspase 3/7 activity was measured after treatment with imatinib, chloroquine, or quinacrine and each autophagy inhibitor in combination with imatinib. Results are the mean ± SD from three independent experiments. The percent increase in caspase 3/7 activity in cells treated with imatinib relative to untreated controls is shown. NT, nontargeting siRNA pool. P values indicated with an asterisk are based on statistical analysis of synergy between imatinib and inhibition of autophagy (see details in
SI Methods
). (E) CC-3 positive cells ± SEM from mouse GIST-T1 xenografts after treatment with imatinib alone or in combination with either chloroquine or quinacrine. (F) Tumor weight ± SEM of mouse GIST-T1 xenografts after treatment with imatinib alone or in combination with either chloroquine or quinacrine. Note that untreated control tumors underestimate tumor size (designated by *) because it is necessary to euthanize all untreated control mice because of excessive tumor growth before the end of the experiment.
Fig. 5.
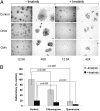
Antimalarials attenuate the outgrowth of imatinib-resistant GIST cells in vitro. (A) Representative images from GIST-T1 cells plated at 100 cells per well and treated for 14 d with 0.1 μM imatinib, 5 μM chloroquine, or 0.5 μM quinacrine either as single agents or in the designated combinations. (B) Quantification of cells per colony under the various conditions; the data are presented as mean ± SEM. P values indicated with an asterisk are based on statistical analysis of synergy between imatinib and inhibition of autophagy (see details in
SI Methods
).
Comment in
- Cancer: Potential new role for antimalarial agents in the treatment of gastrointestinal stromal tumors.
Wood NJ. Wood NJ. Nat Rev Gastroenterol Hepatol. 2010 Oct;7(10):531. doi: 10.1038/nrgastro.2010.143. Nat Rev Gastroenterol Hepatol. 2010. PMID: 20936747 No abstract available.
Similar articles
- Gastrointestinal stromal tumors.
Antonescu C. Antonescu C. Curr Top Microbiol Immunol. 2012;355:41-57. doi: 10.1007/82_2011_161. Curr Top Microbiol Immunol. 2012. PMID: 22015552 Review. - Crosstalk between KIT and FGFR3 Promotes Gastrointestinal Stromal Tumor Cell Growth and Drug Resistance.
Javidi-Sharifi N, Traer E, Martinez J, Gupta A, Taguchi T, Dunlap J, Heinrich MC, Corless CL, Rubin BP, Druker BJ, Tyner JW. Javidi-Sharifi N, et al. Cancer Res. 2015 Mar 1;75(5):880-91. doi: 10.1158/0008-5472.CAN-14-0573. Epub 2014 Nov 28. Cancer Res. 2015. PMID: 25432174 Free PMC article. - Kitlow stem cells cause resistance to Kit/platelet-derived growth factor alpha inhibitors in murine gastrointestinal stromal tumors.
Bardsley MR, Horváth VJ, Asuzu DT, Lorincz A, Redelman D, Hayashi Y, Popko LN, Young DL, Lomberk GA, Urrutia RA, Farrugia G, Rubin BP, Ordog T. Bardsley MR, et al. Gastroenterology. 2010 Sep;139(3):942-52. doi: 10.1053/j.gastro.2010.05.083. Epub 2010 Jun 4. Gastroenterology. 2010. PMID: 20621681 Free PMC article. - Anti-KIT monoclonal antibody inhibits imatinib-resistant gastrointestinal stromal tumor growth.
Edris B, Willingham SB, Weiskopf K, Volkmer AK, Volkmer JP, Mühlenberg T, Montgomery KD, Contreras-Trujillo H, Czechowicz A, Fletcher JA, West RB, Weissman IL, van de Rijn M. Edris B, et al. Proc Natl Acad Sci U S A. 2013 Feb 26;110(9):3501-6. doi: 10.1073/pnas.1222893110. Epub 2013 Feb 4. Proc Natl Acad Sci U S A. 2013. PMID: 23382202 Free PMC article. - Developments in targeted therapy of advanced gastrointestinal stromal tumors.
Rutkowski P, Symonides M, Zdzienicki M, Siedlecki JA. Rutkowski P, et al. Recent Pat Anticancer Drug Discov. 2008 Jun;3(2):88-99. doi: 10.2174/157489208784638749. Recent Pat Anticancer Drug Discov. 2008. PMID: 18537751 Review.
Cited by
- Autophagy and Cancer Dormancy.
Akkoc Y, Peker N, Akcay A, Gozuacik D. Akkoc Y, et al. Front Oncol. 2021 Mar 19;11:627023. doi: 10.3389/fonc.2021.627023. eCollection 2021. Front Oncol. 2021. PMID: 33816262 Free PMC article. Review. - Antitumor Activity of Pt(II), Ru(III) and Cu(II) Complexes.
Gałczyńska K, Drulis-Kawa Z, Arabski M. Gałczyńska K, et al. Molecules. 2020 Jul 31;25(15):3492. doi: 10.3390/molecules25153492. Molecules. 2020. PMID: 32751963 Free PMC article. Review. - New treatment strategies for advanced-stage gastrointestinal stromal tumours.
Klug LR, Khosroyani HM, Kent JD, Heinrich MC. Klug LR, et al. Nat Rev Clin Oncol. 2022 May;19(5):328-341. doi: 10.1038/s41571-022-00606-4. Epub 2022 Feb 25. Nat Rev Clin Oncol. 2022. PMID: 35217782 Free PMC article. Review. - Noncoding RNAs in Drug Resistance of Gastrointestinal Stromal Tumor.
Li J, Guo S, Sun Z, Fu Y. Li J, et al. Front Cell Dev Biol. 2022 Jan 31;10:808591. doi: 10.3389/fcell.2022.808591. eCollection 2022. Front Cell Dev Biol. 2022. PMID: 35174150 Free PMC article. Review. - HAMdb: a database of human autophagy modulators with specific pathway and disease information.
Wang NN, Dong J, Zhang L, Ouyang D, Cheng Y, Chen AF, Lu AP, Cao DS. Wang NN, et al. J Cheminform. 2018 Jul 31;10(1):34. doi: 10.1186/s13321-018-0289-4. J Cheminform. 2018. PMID: 30066211 Free PMC article.
References
- Rubin BP, Heinrich MC, Corless CL. Gastrointestinal stromal tumour. Lancet. 2007;369:1731–1741. - PubMed
- Dematteo RP, Heinrich MC, El-Rifai WM, Demetri G. Clinical management of gastrointestinal stromal tumors: Before and after STI-571. Hum Pathol. 2002;33:466–477. - PubMed
- Blanke CD, et al. Long-term results from a randomized phase II trial of standard- versus higher-dose imatinib mesylate for patients with unresectable or metastatic gastrointestinal stromal tumors expressing KIT. J Clin Oncol. 2008;26:620–625. - PubMed
- Blay JY, et al. Prospective multicentric randomized phase III study of imatinib in patients with advanced gastrointestinal stromal tumors comparing interruption versus continuation of treatment beyond 1 year: The French Sarcoma Group. J Clin Oncol. 2007;25:1107–1113. - PubMed
- Heinrich MC, et al. Molecular correlates of imatinib resistance in gastrointestinal stromal tumors. J Clin Oncol. 2006;24:4764–4774. - PubMed
Publication types
MeSH terms
Substances
LinkOut - more resources
Full Text Sources
Other Literature Sources
Miscellaneous


