Succession of microbial consortia in the developing infant gut microbiome - PubMed (original) (raw)
. 2011 Mar 15;108 Suppl 1(Suppl 1):4578-85.
doi: 10.1073/pnas.1000081107. Epub 2010 Jul 28.
Affiliations
- PMID: 20668239
- PMCID: PMC3063592
- DOI: 10.1073/pnas.1000081107
Succession of microbial consortia in the developing infant gut microbiome
Jeremy E Koenig et al. Proc Natl Acad Sci U S A. 2011.
Abstract
The colonization process of the infant gut microbiome has been called chaotic, but this view could reflect insufficient documentation of the factors affecting the microbiome. We performed a 2.5-y case study of the assembly of the human infant gut microbiome, to relate life events to microbiome composition and function. Sixty fecal samples were collected from a healthy infant along with a diary of diet and health status. Analysis of >300,000 16S rRNA genes indicated that the phylogenetic diversity of the microbiome increased gradually over time and that changes in community composition conformed to a smooth temporal gradient. In contrast, major taxonomic groups showed abrupt shifts in abundance corresponding to changes in diet or health. Community assembly was nonrandom: we observed discrete steps of bacterial succession punctuated by life events. Furthermore, analysis of ≈ 500,000 DNA metagenomic reads from 12 fecal samples revealed that the earliest microbiome was enriched in genes facilitating lactate utilization, and that functional genes involved in plant polysaccharide metabolism were present before the introduction of solid food, priming the infant gut for an adult diet. However, ingestion of table foods caused a sustained increase in the abundance of Bacteroidetes, elevated fecal short chain fatty acid levels, enrichment of genes associated with carbohydrate utilization, vitamin biosynthesis, and xenobiotic degradation, and a more stable community composition, all of which are characteristic of the adult microbiome. This study revealed that seemingly chaotic shifts in the microbiome are associated with life events; however, additional experiments ought to be conducted to assess how different infants respond to similar life events.
Conflict of interest statement
The authors declare no conflict of interest.
Figures
Fig. 1.
Bacterial PD of the infant gut microbiota over time. PD provides a measure of the diversity within a community based on the extent of the 16S rRNA phylogenetic tree that is represented by that community. Symbols are fecal samples. The mother's fecal sample, collected at day 3, is denoted as a filled square.
Fig. 2.
Community composition changes over time conform to a smooth temporal gradient. Time and PC1 from a PCoA of bacterial communities determined from 16S rRNA genes are plotted. (A) The color gradient corresponds to time (days): earlier samples are darkest blue, and later samples are paler. The mother's sample, in red, was assigned an age of 3 d and clusters along PC1 with the older samples from the infant. (B–D) Same data projection as in A; however, days for which breast milk was part of the diet are in blue in B, days with solid food (including rice cereal) are green in C, and days with formula are green in D. Symbols are individual fecal samples; the variance explained by PC1 is indicated on the axis.
Fig. 3.
OTU-based community structure and composition in the gut microbiota. (A) Each vertical lane corresponds to a sample day, and the gray-scale shaded rectangles represent the abundance of the different OTUs. The dendogram on the left shows how the OTUs are clustered according to cooccurrence, and branches are colored to indicate the taxonomical assignment of the OTUs at the phylum level. Samples selected for metagenomic analyses are indicated with asterixes. (B) Relative abundances of the bacterial phyla in each samples. (C) Significant events pertaining to changes in the infant's diet are indicated. Steps characterized by specific bacterial consortia supported by linear discriminate analysis are shown.
Fig. 4.
Community assembly is nonrandom. (A) C-score distributions for observed and randomized OTU occurrence in each sample. (B) Checkerboard indices for observed and randomized OTU occurrence. Values for the observed distributions are indicated with arrows.
Fig. 5.
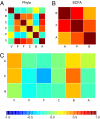
Relationships between phyla abundances and levels of SCFAs in feces. (A–C) Correlation matrices. (A) Phyla (V, Verrucomicrobia; P, Proteobacteria; F, Firmicutes; C, Cyanobacteria; B, Bacteroidetes; A, Actinobacteria). (B) SCFAs (A, acetate; P, propionate; B, butyrate). (C) Cross-correlation between phylum abundances and SCFA concentrations. The color scale indicates that negative correlation values are in blue tones, whereas positive correlation values are red.
Fig. 6.
Metagenomic analysis of DNA sequences extracted from infant fecal DNA. (A) Taxonomic assignment of metagenomic sequences. (B) Heat map and hierarchical clustering of samples based on MG-RAST subsystem gene content.
References
- Gueimonde M, et al. Effect of maternal consumption of lactobacillus GG on transfer and establishment of fecal bifidobacterial microbiota in neonates. J Ped Gastroenterol Nutr. 2006;42:166–170. - PubMed
Publication types
MeSH terms
Substances
LinkOut - more resources
Full Text Sources
Other Literature Sources
Medical
Molecular Biology Databases


