EGFRvIV: a previously uncharacterized oncogenic mutant reveals a kinase autoinhibitory mechanism - PubMed (original) (raw)
EGFRvIV: a previously uncharacterized oncogenic mutant reveals a kinase autoinhibitory mechanism
G Pines et al. Oncogene. 2010.
Abstract
Tumor cells often subvert normal regulatory mechanisms of signal transduction. This study shows this principle by studying yet uncharacterized mutants of the epidermal growth factor receptor (EGFR) previously identified in glioblastoma multiforme, which is the most aggressive brain tumor in adults. Unlike the well-characterized EGFRvIII mutant form, which lacks a portion of the ligand-binding cleft within the extracellular domain, EGFRvIVa and EGFRvIVb lack internal segments distal to the intracellular tyrosine kinase domain. By constructing the mutants and by ectopic expression in naive cells, we show that both mutants confer an oncogenic potential in vitro, as well as tumorigenic growth in animals. The underlying mechanisms entail constitutive receptor dimerization and basal activation of the kinase domain, likely through a mechanism that relieves a restraining molecular fold, along with stabilization due to association with HSP90. Phosphoproteomic analyses delineated the signaling pathways preferentially engaged by EGFRvIVb-identified unique substrates. This information, along with remarkable sensitivities to tyrosine kinase blockers and to a chaperone inhibitor, proposes strategies for pharmacological interception in brain tumors harboring EGFRvIV mutations.
Conflict of interest statement
Conflict of interest
The authors declare no conflict of interest.
Figures
Figure 1
Transforming activities of the EGFRvIV deletion mutants. (a) Schematic representation of the EGFR deletion mutations that are the main focus of this study. Amino acid numbers are indicated, along with mutants’ names. (b) NIH-3T3 cells stably expressing the indicated forms of EGFR (or a vector control; NeoR) were grown for the indicated time intervals and stained with methyl violet. Optical density was measured after dye dissolution. Averages ± s.d. (bars) are shown. Inset: an immunoblot of whole lysates of the indicated NIH-3T3 cell derivatives using an anti-EGFR antibody. (c) NIH-3T3 cells expressing the indicated EGFR mutants were incubated with either AG1478 (1 µM) or with dimethylsulfoxide (DMSO) as solvent control. Cells were incubated for 5 days before digital images were taken. Scale bar = 50 µm. (d) Murine fibroblasts stably expressing the indicated forms of EGFR were plated in a mixture of agar and medium. Shown images were captured 5 weeks later. Colony coverage was measured using the ImageJ software. Each box plot is composed of five horizontal lines that show the 10th, 25th, 50th, 75th and 90th percentiles of the respective sample. Scale bar=0.5 mm. (e) The indicated stable derivatives of NIH-3T3 cells were injected subcutaneously into nude mice (2 × 10⁶ cells/animal) and tumor volumes were measured. Averages ± s.e. (bars) are shown. Inset: an immunoblot of whole lysates of the indicated NIH-3T3 cell derivatives using an anti-EGFR antibody and an antibody to phosphorylated tyrosine 1068 of EGFR. SP, signal peptide; CRD, cysteine-rich domain; TM, transmembrane; TK, tyrosine kinase.
Figure 2
The EGFRvIV mutants are basally phosphorylated. (a) The cells from the experiment shown in Figure 1c were extracted and subjected to immunoblotting using the indicated antibodies. (b) NIH-3T3 cells expressing the indicated EGFR mutants were incubated for 10 min without or with EGF (10 ng/ml), and the phosphorylation status of the indicated tyrosine residues of EGFR was determined by immunoblotting. (c) Murine fibroblasts ectopically expressing different forms of human EGFR were lysed, whole extracts were processed and MS/MS spectra obtained as detailed under Materials and methods. Centered signals of all phosphotyrosine-containing peptides of the cells were grouped into the indicated three clusters (see Materials and methods). See Supplementary Excel File (sheet 2). (d) Three EGFR tyrosine phosphorylation sites were identified by LC/MS/MS: Y1086, Y1148 and Y1173. The relative phosphorylation levels of the various EGFR forms in the basal state are indicated.
Figure 3
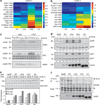
Constitutive signaling by the EGFRvIV mutants. (a, b) Murine fibroblasts ectopically expressing the indicated forms of EGFR were subjected to phosphoproteomic analyses, and phosphorylation levels of signaling and adaptor proteins presented as heatmaps. Listed are specific tyrosine phosphorylation sites of substrates assigned to clusters 2 and 3. SeeSupplementary Excel File (sheet 1). (c) NIH-3T3 cells expressing the indicated EGFR mutants were incubated for 10 min without or with EGF. Cell lysates were subjected to immunoprecipitation (IP) using an antibody to EGFR and immunoblotting (IB) using antibodies specific to the adaptor proteins SHC and GRB2. Whole cell extracts were also analyzed. (d) NIH-3T3 cells expressing the indicated EGFR mutants were incubated for 10 min without or with EGF. Cell lysates were subjected to IB using antibodies to the general and the phosphorylated forms (pERK and pAKT) of extracellular signal-regulated kinase (ERK) and AKT. Numbers indicate normalized intensities of phosphorylated bands. (e) NIH-3T3 cells expressing the indicated EGFR mutants were incubated without or with EGF (10 ng/ml) for the indicated intervals. The relative levels of JUN were determined by IB (upper panel). The bands were quantified and normalized according to RAS-GAP. The dashed line marks the basal level of JUN induction in WT-EGFR-expressing cells. (f) NIH-3T3 cells expressing the indicated EGFR forms were treated without or with EGF (10 ng/ml; 10 min). Cell lysates were subjected to IP with an antibody directed against phosphotyrosine (pY) and IB for the EPHA2 receptor.
Figure 4
EGFRvIV shows constitutive, but partial, dimerization and autophosphorylation. (a) NIH-3T3 cells expressing either WT-EGFR or EGFRvIVb were incubated for 20 min with increasing EGF concentrations. Thereafter, the cells were extracted and analyzed by immunoblotting (IB) with the indicated antibodies. (b) Phospho-EGFR levels were derived from (a) by quantifying and normalizing band intensities. The lower panel enlarges the low range of EGF concentrations shown in the upper panel. (c) U87MG and NIH-3T3 cells stably expressing the indicated forms of ectopic EGFR were untreated or treated without or with EGF (10 ng/ml; 10 min). Whole cell extracts were prepared, cleared and incubated without or with a covalent crosslinking reagent, BS3 (2 m
m
, 20 min), and subjected to immunoblotting analysis using an antibody specific to phosphorylated tyrosine 1068 of EGFR. D and M indicate EGFR dimers and monomers, respectively. (d) WT-EGFR and the EGFRvIV mutants were mutated at residue 293 (glutamate-to-alanine replacement). CHO cells were transfected with the indicated EGFR constructs, including double mutants carrying both the E293A mutation and a deletion, and incubated without or with EGF (10 ng/ml; 10 min). Whole cell extracts were immunoblotted with the indicated antibodies.
Figure 5
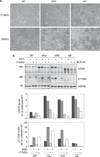
The EGFRvIV mutants serve as clients of HSP90. (a) NIH-3T3 cells expressing the indicated forms of EGFR were incubated with either 17-AAG (50 n
m
; an HSP90 inhibitor) or with solvent (DMSO). Cells were incubated for 4 days before digital images were taken. Scale bar = 50 µm. (b) NIH-3T3 cells expressing the indicated EGFR mutants were incubated without or with 17-AAG (24 h; 50 n
m
) and without or with EGF (10 min). Cleared cell extracts were resolved by electrophoresis and immunoblotting with the indicated antibodies. The lower panels show quantification of total and phospho-EGFR levels, determined according to band intensities and normalization.
Figure 6
A model that compares WT-EGFR and two oncogenic mutants, EGFRvIV and EGFRvIII. The red circles indicate phosphorylated tyrosine residues; the yellow rectangle marks the segment missing in the C-tail of EGFRvIV mutants. Unlike EGFRvIII, WT-EGFR and the EGFRvIV mutants can be stimulated by growth factors. On the other hand, both EGFRvIV and EGFRvIII show constitutive autophosphorylation that differentiates them from WT-EGFR and likely enhances aggressiveness of brain tumors.
Similar articles
- Constitutive asymmetric dimerization drives oncogenic activation of epidermal growth factor receptor carboxyl-terminal deletion mutants.
Park AK, Francis JM, Park WY, Park JO, Cho J. Park AK, et al. Oncotarget. 2015 Apr 20;6(11):8839-50. doi: 10.18632/oncotarget.3559. Oncotarget. 2015. PMID: 25826094 Free PMC article. - Aptamer targeting EGFRvIII mutant hampers its constitutive autophosphorylation and affects migration, invasion and proliferation of glioblastoma cells.
Camorani S, Crescenzi E, Colecchia D, Carpentieri A, Amoresano A, Fedele M, Chiariello M, Cerchia L. Camorani S, et al. Oncotarget. 2015 Nov 10;6(35):37570-87. doi: 10.18632/oncotarget.6066. Oncotarget. 2015. PMID: 26461476 Free PMC article. - Differential gene expression analysis reveals generation of an autocrine loop by a mutant epidermal growth factor receptor in glioma cells.
Ramnarain DB, Park S, Lee DY, Hatanpaa KJ, Scoggin SO, Otu H, Libermann TA, Raisanen JM, Ashfaq R, Wong ET, Wu J, Elliott R, Habib AA. Ramnarain DB, et al. Cancer Res. 2006 Jan 15;66(2):867-74. doi: 10.1158/0008-5472.CAN-05-2753. Cancer Res. 2006. PMID: 16424019 - The EGFRvIII variant in glioblastoma multiforme.
Gan HK, Kaye AH, Luwor RB. Gan HK, et al. J Clin Neurosci. 2009 Jun;16(6):748-54. doi: 10.1016/j.jocn.2008.12.005. Epub 2009 Mar 25. J Clin Neurosci. 2009. PMID: 19324552 Review. - Epidermal growth factor receptor: a re-emerging target in glioblastoma.
Hegi ME, Rajakannu P, Weller M. Hegi ME, et al. Curr Opin Neurol. 2012 Dec;25(6):774-9. doi: 10.1097/WCO.0b013e328359b0bc. Curr Opin Neurol. 2012. PMID: 23007009 Review.
Cited by
- EGFR signaling and pharmacology in oncology revealed with innovative BRET-based biosensors.
Gross F, Mancini A, Breton B, Kobayashi H, Pereira PHS, Le Gouill C, Bouvier M, Schann S, Leroy X, Sabbagh L. Gross F, et al. Commun Biol. 2024 Mar 1;7(1):250. doi: 10.1038/s42003-024-05965-5. Commun Biol. 2024. PMID: 38429428 Free PMC article. - Epidermal Growth Factor Receptor Inhibitors in Glioblastoma: Current Status and Future Possibilities.
Ezzati S, Salib S, Balasubramaniam M, Aboud O. Ezzati S, et al. Int J Mol Sci. 2024 Feb 15;25(4):2316. doi: 10.3390/ijms25042316. Int J Mol Sci. 2024. PMID: 38396993 Free PMC article. Review. - Allosteric activation of preformed EGF receptor dimers by a single ligand binding event.
Purba ER, Saita EI, Akhouri RR, Öfverstedt LG, Wilken G, Skoglund U, Maruyama IN. Purba ER, et al. Front Endocrinol (Lausanne). 2022 Nov 30;13:1042787. doi: 10.3389/fendo.2022.1042787. eCollection 2022. Front Endocrinol (Lausanne). 2022. PMID: 36531494 Free PMC article. - Distribution and favorable prognostic implication of genomic EGFR alterations in IDH-wildtype glioblastoma.
Higa N, Akahane T, Hamada T, Yonezawa H, Uchida H, Makino R, Watanabe S, Takajo T, Yokoyama S, Kirishima M, Matsuo K, Fujio S, Hanaya R, Tanimoto A, Yoshimoto K. Higa N, et al. Cancer Med. 2023 Jan;12(1):49-60. doi: 10.1002/cam4.4939. Epub 2022 Jun 13. Cancer Med. 2023. PMID: 35695190 Free PMC article. - Expanding the Disorder-Function Paradigm in the C-Terminal Tails of Erbbs.
Pinet L, Assrir N, van Heijenoort C. Pinet L, et al. Biomolecules. 2021 Nov 14;11(11):1690. doi: 10.3390/biom11111690. Biomolecules. 2021. PMID: 34827688 Free PMC article. Review.
References
- An WG, Schulte TW, Neckers LM. The heat shock protein 90 antagonist geldanamycin alters chaperone association with p210bcrabl and v-src proteins before their degradation by the proteasome. Cell Growth Differ. 2000;11:355–360. - PubMed
- Burgess AW, Cho HS, Eigenbrot C, Ferguson KM, Garrett TP, Leahy DJ, et al. An open-and-shut case? Recent insights into the activation of EGF/ErbB receptors. Mol Cell. 2003;12:541–552. - PubMed
- Chiara F, Bishayee S, Heldin CH, Demoulin JB. Autoinhibition of the platelet-derived growth factor beta-receptor tyrosine kinase by its C-terminal tail. J Biol Chem. 2004;279:19732–19738. - PubMed
- Chiosis G, Huezo H, Rosen N, Mimnaugh E, Whitesell L, Neckers L. 17AAG: low target binding affinity and potent cell activity– finding an explanation. Mol Cancer Ther. 2003;2:123–129. - PubMed
- Clarkson RW, Boland MP, Kritikou EA, Lee JM, Freeman TC, Tiffen PG, et al. The genes induced by signal transducer and activators of transcription (STAT)3 and STAT5 in mammary epithelial cells define the roles of these STATs in mammary development. Mol Endocrinol. 2006;20:675–685. - PubMed
Publication types
MeSH terms
Grants and funding
- CA072981/CA/NCI NIH HHS/United States
- CA118705/CA/NCI NIH HHS/United States
- R01 CA072981/CA/NCI NIH HHS/United States
- U54 CA112967/CA/NCI NIH HHS/United States
- R37 CA072981/CA/NCI NIH HHS/United States
- U54-CA112967/CA/NCI NIH HHS/United States
- U01 CA141556/CA/NCI NIH HHS/United States
- R01 CA118705/CA/NCI NIH HHS/United States
- CA141556/CA/NCI NIH HHS/United States
LinkOut - more resources
Full Text Sources
Other Literature Sources
Medical
Research Materials
Miscellaneous


