MeCP2 binds cooperatively to its substrate and competes with histone H1 for chromatin binding sites - PubMed (original) (raw)
MeCP2 binds cooperatively to its substrate and competes with histone H1 for chromatin binding sites
Rajarshi P Ghosh et al. Mol Cell Biol. 2010 Oct.
Abstract
Sporadic mutations in the hMeCP2 gene, coding for a protein that preferentially binds symmetrically methylated CpGs, result in the severe neurological disorder Rett syndrome (RTT). In the present work, employing a wide range of experimental approaches, we shed new light on the many levels of MeCP2 interaction with DNA and chromatin. We show that strong methylation-independent as well as methylation-dependent binding by MeCP2 is influenced by DNA length. Although MeCP2 is strictly monomeric in solution, its binding to DNA is cooperative, with dimeric binding strongly correlated with methylation density, and strengthened by nearby A/T repeats. Dimeric binding is abolished in the F155S and R294X severe RTT mutants. MeCP2 also binds chromatin in vitro, resulting in compaction-related changes in nucleosome architecture that resemble the classical zigzag motif induced by histone H1 and considered important for 30-nm-fiber formation. In vivo chromatin binding kinetics and in vitro steady-state nucleosome binding of both MeCP2 and H1 provide strong evidence for competition between MeCP2 and H1 for common binding sites. This suggests that chromatin binding by MeCP2 and H1 in vivo should be viewed in the context of competitive multifactorial regulation.
Figures
FIG. 1.
DNA-MeCP2 interactions. (a to f) AFM images of MeCP2-DNA complexes. (a to c) DNA strands with circular (single arrows) and elliptical (double arrows) MeCP2 foci. (d and e) DNA loops with circular MeCP2 foci at the base. (f) Large complex containing multiple DNA strands and MeCP2 molecules. Scale bar = 50 nm. (g) Histogram of the calculated volumes of individual MeCP2 foci indicating two Gaussian distributions, with mean volumes of 88 nm3 and 157 nm3, close to those expected for the MeCP2 monomer and dimer, respectively. The elliptical foci center on the higher value. (h) Normalized ls_g_*(s)-versus-S20,w plot showing sedimentation coefficient distributions of 45 bp of DNA and complexes comprising 45 bp of DNA and MeCP2 at increasing (0-, 1-, 2-, 3-, 4-, and 5-fold) molar inputs of MeCP2. The fold input of MeCP2 increases from left to right. Saturation is reached at a 4-fold input. A small peak at 2.5 S represents free MeCP2 at the 5-fold protein input. (i) Normalized plot of change in fluorescence anisotropy of a fluorescein-labeled, unmethylated 23-bp DNA at various MeCP2/DNA ratios. Saturation is reached at a 2-fold input of MeCP2. Error bars represent standard errors of the means (SEM). (j) Multiwavelength, multispeed sedimentation equilibrium profile of the unmethylated 11-bp DNA substrate incubated with MeCP2 (3 μM DNA-3 μM protein) in 200 mM NaCl. Data were collected at 230 nm (circles), 260 nm (squares), and 280 nm (triangles) and speeds of 15,000 (green), 20,000 (red), and 25,000 (blue) rpm. Solid lines represent global fits obtained using the A+B heteroassociation model, where A represents DNA and B represents protein. The residuals of the fits are shown in the top panel.
FIG. 2.
Sedimentation equilibrium reveals mechanistic details of DNA binding by MeCP2. (a and b) Multiwavelength, multispeed sedimentation equilibrium of MeCP2 with an equimolar amount of trimethylated 45-bp DNA in 200 mM NaCl (1.3 μM DNA-1.3 μM protein). Data were collected at 230 nm (circles), 260 nm (squares), and 280 nm (triangles) and speeds of 10,000 (green), 14,000 (red), and 18,000 (blue) rpm. Solid lines represent global fits obtained using an A+B heteroassociation model (a) or an A+B+B model (b). Note the very small residuals in panel b, indicating that MeCP2 binding to longer DNA follows an A+B+B heteroassociation model at protein/DNA ratios of ≤1. (c) Summary of the sedimentation equilibrium data showing for each DNA substrate the fraction existing as A, AB, and ABB, as determined from the binding parameters given in Table 2, using the mass action law option in SEDPHAT and input concentrations of 0.5 μM for MeCP2 and 0.5 μM for DNA. The error in the calculations is the same as that presented in Table 2 in the “Mean RMSD of all local fits” column. (d and e) Multiwavelength, multispeed sedimentation equilibrium of the interaction of MeCP2 with 45 bp of monomethylated DNA in 200 mM NaCl at an input ratio of 1:3 (DNA/MeCP2) and data collected at 230 nm (circles), 260 nm (squares), and 280 nm (triangles) and speeds of 10,000 (green), 14,000 (red), and 18,000 (blue) rpm. Solid lines represent global fits obtained using the A+B+B+B heteroassociation model (d) and the A+B+B heteroassociation model (e). Residuals show that at this input ratio, the A+B+B+B model provides a better fit.
FIG. 3.
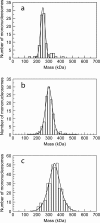
STEM mass analysis of the interaction between 207-bp nucleosomes and MeCP2. (a) Nucleosomes without MeCP2. (b, c) Unmethylated (b) and methylated (c) nucleosomes treated with 2 MeCP2 molecules per nucleosome. Peaks of the Gaussian fits correspond to nucleosomes alone (a) and nucleosomes with one (b) and two (c) bound MeCP2 molecules. Unpaired t tests indicate that the differences between the populations are highly significant (P < 10e−10).
FIG. 4.
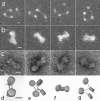
MeCP2 compacts tetranucleosomes. (a) Tetranucleosomes in 50 mM NaCl exhibit the expected open beaded-string configuration. (b and c) In the presence of 2 MeCP2 molecules per nucleosome, the tetranucleosomes fold into a compact “bow tie” conformation similar to that observed in compact tetranucleosome crystals (53). (d, e, f, and g) Models derived from stereo pair images as viewed from 2 directions support the hypothesis that MeCP2 induces compaction primarily through zigzag folding. (a and b) Positive-stain TEM dark field. (c) Negative-stain TEM. (d to g) Models based on stereo images of negatively stained preparations. Scales = 10 nm.
FIG. 5.
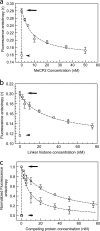
MeCP2 and histone H1 compete for nucleosome-binding sites in vitro. (a) Fluorescence anisotropy of 10 nM TMR-labeled H10 (circles) by itself (lower short arrow), upon incubation with an equimolar amount of 172-bp (the approximate chromatosome length) nucleosomes (upper long arrow), and upon incubation of the binary complex with increasing amounts of unlabeled MeCP2. (b) Same as for panel a, but with TMR-MeCP2 (squares) incubated with increasing amounts of unlabeled H10. (c) Normalized version of data shown in panels a and b. At an equimolar input of unlabeled MeCP2, ∼70% labeled H10 is excluded from mononucleosomes, whereas with unlabeled H10, ∼30% of labeled MeCP2 is competed out. Error bars represent SEM. Data are based on 3 separate acquisitions for each experiment type.
FIG. 6.
Microinjection does not affect general cellular health and allows visualization of the overlapping distribution of MeCP2 and H10. (a) Fluorescence imaging indicates that microinjected TMR-H10 (red) colocalizes with MeCP2-GFP (green), especially in PHC (merged image at right). Scale bar = 5 μm. (b) Images of H10-GFP-expressing nuclei indicate that H10-GFP (green) and microinjected TMR-MeCP2 (red) colocalize particularly well in PHC (merged image). Hoechst staining (cyan, far right) shows a very similar distribution. (c) Microinjected cells can be identified by the red fluorescence of Texas Red-dextran in the cytoplasm. Microinjection does not alter the nuclear morphology or the fluorescence of H10-GFP (green). Scale bar = 20 μm.
FIG. 7.
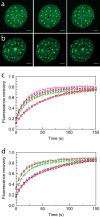
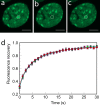
Microinjection of MeCP2 accelerates the FRAP kinetics of H10-GFP in heterochromatin and euchromatin. (a and b) Confocal images of cells expressing H10-GFP, where a 1-μm radius spot of EU (a) or HC (b) was bleached and the recovery monitored over time. From left to right are prebleaching, bleaching, and postbleaching images. (c and d) FRAP profiles of H10-GFP in 1-μm-radius bleached spots in EU (c) and HC (d) in uninjected (□) and mock-injected (⋄) cells. FRAP curves are also shown for H10-GFP cells injected with H10 (⋆), MeCP2 (▵), and transiently transfected with MeCP2-RFP plasmid (○). Error bars represent SEM. FRAP profiles show the mean values for 20 or more different nuclei.
FIG. 8.
FRAP kinetics of MeCP2-GFP in pericentromeric heterochromatin is regulated by H1 concentration and the methylation status of chromatin. (a and b) Microinjection of H10 accelerates MeCP2-GFP FRAP in HC. (a) FRAP at a 1-μm-radius heterochromatic spot in a cell expressing GFP-tagged MeCP2. From left to right are prebleaching, bleaching, and postbleaching images. (b) FRAP profiles of GFP-tagged MeCP2 in HC in control cells (red) and cells injected with 250 μM (blue), and 500 μM (brown) H10. Error bars represent SEM. The FRAP profiles show the mean values for 20 or more different nuclei. Scale bar = 5 μm. (c to h) Treatment with 5-Aza-dC reduces DNA methylation and MeCP2 binding in PHC. (c and d) Immunodetection of methyl cytosine in MeCP2-GFP-expressing cells reveals that upon 5-Aza-dC treatment there is a marked loss of methylation in PHC (d) compared to the level for untreated cells (c). Scale bar = 5 μm. (e) Fluorescence recovery profile of MeCP2 in HC of nuclei treated with 5-Aza-dC. FRAP profiles show the mean values for 20 or more different nuclei. FRAP was performed in nuclei in which the fluorescence intensities in HC were at least half of the values for untreated nuclei. The effect of demethylation on MeCP2 binding kinetics is therefore underestimated. Error bars represent SEM. (f) MeCP2-GFP fluorescence intensity in PHC of cells treated with 5-Aza-dC (n = 300) or dimethyl sulfoxide (DMSO) only (n = 351). Nuclei in which GFP fluorescence of PHC foci was absent are not included. (g) Distribution of anti-5-methyl cytosine antibody in nuclei of cells treated with 5-Aza-dC (n = 300) or DMSO only (n = 300). (h) The Hoechst fluorescence intensity in PHC foci of cells treated with 5-Aza-dC (n = 400) is similar to the level for the DMSO-only control (n = 351).
FIG. 9.
Microinjection of H10 does not alter HP1α-GFP FRAP kinetics in heterochromatin after photobleaching. (a to c) FRAP kinetics at a 1-μm-radius heterochromatic spot in a cell expressing HP1α-GFP. Scale bar = 5 μm. From left to right are prebleaching, bleaching, and postbleaching images. (d) FRAP profiles of HP1α-GFP in HC in uninjected cells (red) as well as cells injected with 250 μM H10 (green). Error bars represent SEM. FRAP profiles show the mean values for 20 or more different nuclei.
Similar articles
- Binding of the Rett syndrome protein, MeCP2, to methylated and unmethylated DNA and chromatin.
Hansen JC, Ghosh RP, Woodcock CL. Hansen JC, et al. IUBMB Life. 2010 Oct;62(10):732-8. doi: 10.1002/iub.386. IUBMB Life. 2010. PMID: 21031501 Free PMC article. Review. - MeCP2-chromatin interactions include the formation of chromatosome-like structures and are altered in mutations causing Rett syndrome.
Nikitina T, Ghosh RP, Horowitz-Scherer RA, Hansen JC, Grigoryev SA, Woodcock CL. Nikitina T, et al. J Biol Chem. 2007 Sep 21;282(38):28237-45. doi: 10.1074/jbc.M704304200. Epub 2007 Jul 27. J Biol Chem. 2007. PMID: 17660293 - Analysis of protein domains and Rett syndrome mutations indicate that multiple regions influence chromatin-binding dynamics of the chromatin-associated protein MECP2 in vivo.
Kumar A, Kamboj S, Malone BM, Kudo S, Twiss JL, Czymmek KJ, LaSalle JM, Schanen NC. Kumar A, et al. J Cell Sci. 2008 Apr 1;121(Pt 7):1128-37. doi: 10.1242/jcs.016865. Epub 2008 Mar 11. J Cell Sci. 2008. PMID: 18334558 Free PMC article. - Multiple modes of interaction between the methylated DNA binding protein MeCP2 and chromatin.
Nikitina T, Shi X, Ghosh RP, Horowitz-Scherer RA, Hansen JC, Woodcock CL. Nikitina T, et al. Mol Cell Biol. 2007 Feb;27(3):864-77. doi: 10.1128/MCB.01593-06. Epub 2006 Nov 13. Mol Cell Biol. 2007. PMID: 17101771 Free PMC article. - MeCP2, A Modulator of Neuronal Chromatin Organization Involved in Rett Syndrome.
Martínez de Paz A, Ausió J. Martínez de Paz A, et al. Adv Exp Med Biol. 2017;978:3-21. doi: 10.1007/978-3-319-53889-1_1. Adv Exp Med Biol. 2017. PMID: 28523538 Review.
Cited by
- Differential dynamics specify MeCP2 function at nucleosomes and methylated DNA.
Chua GNL, Watters JW, Olinares PDB, Begum M, Vostal LE, Luo JA, Chait BT, Liu S. Chua GNL, et al. Nat Struct Mol Biol. 2024 Nov;31(11):1789-1797. doi: 10.1038/s41594-024-01373-9. Epub 2024 Aug 20. Nat Struct Mol Biol. 2024. PMID: 39164525 Free PMC article. - Testing the PEST hypothesis using relevant Rett mutations in MeCP2 E1 and E2 isoforms.
Kalani L, Kim BH, de Chavez AR, Roemer A, Mikhailov A, Merritt JK, Good KV, Chow RL, Delaney KR, Hendzel MJ, Zhou Z, Neul JL, Vincent JB, Ausió J. Kalani L, et al. Hum Mol Genet. 2024 Nov 5;33(21):1833-1845. doi: 10.1093/hmg/ddae119. Hum Mol Genet. 2024. PMID: 39137370 Free PMC article. - Epigenetics in rare neurological diseases.
Roberts CT, Arezoumand KS, Kadar Shahib A, Davie JR, Rastegar M. Roberts CT, et al. Front Cell Dev Biol. 2024 Jul 23;12:1413248. doi: 10.3389/fcell.2024.1413248. eCollection 2024. Front Cell Dev Biol. 2024. PMID: 39108836 Free PMC article. Review. - Extending MeCP2 interactome: canonical nucleosomal histones interact with MeCP2.
Ortega-Alarcon D, Claveria-Gimeno R, Vega S, Kalani L, Jorge-Torres OC, Esteller M, Ausio J, Abian O, Velazquez-Campoy A. Ortega-Alarcon D, et al. Nucleic Acids Res. 2024 Apr 24;52(7):3636-3653. doi: 10.1093/nar/gkae051. Nucleic Acids Res. 2024. PMID: 38321951 Free PMC article. - The Proteomic Composition and Organization of Constitutive Heterochromatin in Mouse Tissues.
Schmidt A, Zhang H, Schmitt S, Rausch C, Popp O, Chen J, Cmarko D, Butter F, Dittmar G, Lermyte F, Cardoso MC. Schmidt A, et al. Cells. 2024 Jan 11;13(2):139. doi: 10.3390/cells13020139. Cells. 2024. PMID: 38247831 Free PMC article.
References
- Adams, V. H., S. J. McBryant, P. A. Wade, C. L. Woodcock, and J. C. Hansen. 2007. Intrinsic disorder and autonomous region function in the multifunctional nuclear protein, MeCP2. J. Biol. Chem. 282:15057-15064. - PubMed
- Amir, R. E., I. B. den Veyber, M. Wan, C. Q. Tran, U. Francke, and H. Y. Zoghbi. 1999. Rett syndrome is caused by mutations in X-linked MECP2, encoding methyl-CpG-binding protein 2. Nat. Genet. 23:185-188. - PubMed
- Bednar, J., R. A. Horowitz, S. A. Grigoryev, L. M. Carruthers, J. C. Hansen, A. J. Koster, and C. L. Woodcock. 1998. Nucleosomes, linker DNA, and linker histone form a unique structural motif that directs the higher-order folding and compaction of chromatin. Proc. Natl. Acad. Sci. U. S. A. 95:14173-14178. - PMC - PubMed
Publication types
MeSH terms
Substances
LinkOut - more resources
Full Text Sources


