Blockade of endothelial-mesenchymal transition by a Smad3 inhibitor delays the early development of streptozotocin-induced diabetic nephropathy - PubMed (original) (raw)
. 2010 Oct;59(10):2612-24.
doi: 10.2337/db09-1631. Epub 2010 Aug 3.
Affiliations
- PMID: 20682692
- PMCID: PMC3279546
- DOI: 10.2337/db09-1631
Blockade of endothelial-mesenchymal transition by a Smad3 inhibitor delays the early development of streptozotocin-induced diabetic nephropathy
Jinhua Li et al. Diabetes. 2010 Oct.
Abstract
Objective: A multicenter, controlled trial showed that early blockade of the renin-angiotensin system in patients with type 1 diabetes and normoalbuminuria did not retard the progression of nephropathy, suggesting that other mechanism(s) are involved in the pathogenesis of early diabetic nephropathy (diabetic nephropathy). We have previously demonstrated that endothelial-mesenchymal-transition (EndoMT) contributes to the early development of renal interstitial fibrosis independently of microalbuminuria in mice with streptozotocin (STZ)-induced diabetes. In the present study, we hypothesized that blocking EndoMT reduces the early development of diabetic nephropathy.
Research design and methods: EndoMT was induced in a mouse pancreatic microvascular endothelial cell line (MMEC) in the presence of advanced glycation end products (AGEs) and in the endothelial lineage-traceble mouse line Tie2-Cre;Loxp-EGFP by administration of AGEs, with nonglycated mouse albumin serving as a control. Phosphorylated Smad3 was detected by immunoprecipitation/Western blotting and confocal microscopy. Blocking studies using receptor for AGE siRNA and a specific inhibitor of Smad3 (SIS3) were performed in MMECs and in STZ-induced diabetic nephropathy in Tie2-Cre;Loxp-EGFP mice.
Results: Confocal microscopy and real-time PCR demonstrated that AGEs induced EndoMT in MMECs and in Tie2-Cre;Loxp-EGFP mice. Immunoprecipitation/Western blotting showed that Smad3 was activated by AGEs but was inhibited by SIS3 in MMECs and in STZ-induced diabetic nephropathy. Confocal microscopy and real-time PCR further demonstrated that SIS3 abrogated EndoMT, reduced renal fibrosis, and retarded progression of nephropathy.
Conclusions: EndoMT is a novel pathway leading to early development of diabetic nephropathy. Blockade of EndoMT by SIS3 may provide a new strategy to retard the progression of diabetic nephropathy and other diabetes complications.
Figures
FIG. 1.
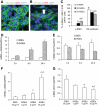
AGEs induced EndoMT in MMECs. MMECs were cultured in the presence of AGEs (25 μg/ml) or BSA (25 μg/ml) for 3 and 7 days (3d AGEs, 7d BSA, and 7d AGEs). Confocal microscopy demonstrated the expression of VE-cadherin (green), α-SMA (red), and DAPI nuclear staining (blue) in MMECs after culture with either BSA (A) or AGEs (B) for 7 days. Arrow indicates a VE-cadherin+/α-SMA+ cell. C: Quantitation of the percentages of VE-cadherin– and α-SMA–positive cells in total DAPI-positive cells. One-way ANOVA, a, vs. 7d BSA, b (P < 0.05) b, vs. 3d AGEs (_P_ < 0.05). Real-time PCR demonstrated mRNA levels of α-SMA (_D_ and _F_) and CD31 (_E_ and _G_) in MMECs cultured in the presence of BSA or AGEs for 3, 6, and 24 h (_D_ and _E_) and with different concentrations of AGEs and BSA for 24 h (_F_ and _G_). _D_: Two-way ANOVA, time, _P_ < 0.05; treatment, _P_ < 0.05; interaction, _P_ < 0.05. _E_: Two-way ANOVA, time, _P_ > 0.05; treatment, P < 0.05; interaction, P < 0.05. F: c, vs. 25 μg/ml BSA or 1 μg/ml AGEs, P < 0.05; d, vs. 5 μg/ml AGEs, P < 0.05. G: e, vs. 25 μg/ml BSA or 1 μg/ml AGEs, P < 0.05; f, vs. 5 μg/ml AGEs, P < 0.05. (A high-quality digital representation of this figure is available in the online issue.)
FIG. 2.
Infusion of AGEs into Tie2-Cre;Loxp-EGFP mice induced EndoMT. Confocal microscopy demonstrated EGFP (green), α-SMA (red), and DAPI (blue) staining in MSA-treated (A) and AGEs-treated (B) mouse kidneys. Arrow indicates EGFP+/α-SMA+ cells in an AGEs-treated kidney (seen at higher magnification in C–E). Arrow heads indicate EGFP−/α-SMA+ cells in an AGEs-treated kidney (seen at higher magnification in F–H. Original magnification: A and B, 600×; C and H, 1,200×. I: Quantification of percentage of α-SMA+/EGFP+ cells in total α-SMA+ cells in MSA-treated and AGEs-treated kidneys. a, vs. MSA-treated group, P < 0.05. (A high-quality digital representation of this figure is available in the online issue.)
FIG. 3.
AGE-induced EndoMT was RAGE-mediated in MMECs. Confocal microscopy demonstrated the expression of RAGE (green), CD31 (red), and DAPI (blue) in kidney 1 month after administration of either normal saline (A) or STZ (B). Original magnification for A and B, 600×. C: Mouse renal endothelial cells were treated with control siRNA (CTL siRNA) and RAGE siRNA for 24 h and then stimulated with BSA or AGEs for 48 h. Western blotting demonstrated the expression of RAGE, VE-cadherin (VE-cad), α-SMA, and GAPDH. D and E: Real-time PCR demonstrated mRNA levels of α-SMA (D) and CD31 (E) in MMECs after culture with BSA, AGEs, AGEs plus goat anti-RAGE neutralizing antibody or AGEs plus goat IgG for 24 h. a, vs. BSA, P < 0.05; b, vs. AGEs and AGEs plus goat IgG, respectively, P < 0.05. (A high-quality digital representation of this figure is available in the online issue.)
FIG. 4.
RAGE-mediated EndoMT and diabetic (DM) renal fibrosis. PAS staining showed histological changes in RAGE–wild-type (RAGE+/+) (A and C), RAGE-null (RAGE−/−) (B and D), nondiabetic (A and B), and diabetic (C and D) kidneys at 32 weeks of age. Confocal microscopy demonstrated vWF (green), α-SMA (red), and DAPI (blue) in nondiabetic RAGE+/+ (E), nondiabetic RAGE−/− (F), diabetic RAGE+/+ (G–J), and diabetic RAGE−/− (K) kidneys. Original magnification: A–D, 400×; E–G and K, 600×; and H–J, 1800×. Quantification of number of α-SMA+ renal interstitial myofibroblasts (L) and percentage of vWF+/α-SMA+ cells in total α-SMA+ cells (M). a, vs. nondiabetic kidneys, P < 0.05; b, vs. diabetic RAGE+/+ kidneys, P < 0.05. (A high-quality digital representation of this figure is available in the online issue.)
FIG. 5.
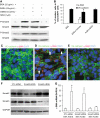
AGE-induced activation of Smad3 was RAGE mediated in MMECs. MMECs were cultured in the presence of AGEs and BSA for 15–120 min or with different concentrations of AGEs for 30 min. Immunoprecipitation (IP) and Western blotting (WB) demonstrated the time course (A) and dose response (B) of Smad3 phosphorylation (p-Smad3) and total Smad3 levels in MMECs. C: MMECs were pretreated with control siRNA (CTL siRNA) or RAGE siRNA for 2 days and then cultured in the presence of BSA or AGEs for 30 min. Immunoprecipitation/Western blotting demonstrated RAGE, p-Smad3, and total Smad3 in MMECs. D: MMECs were pretreated with goat anti-RAGE neutralizing antibody or goat IgG for 30 min and then cultured in the presence of AGEs. Upper panel: Immunoprecipitation/Western blotting demonstrated Smad3 phosphorylation and total Smad3 in MMECs. Lower panel: quantitation of arbitrary ratio of Smad3 phosphorylation/Smad3 in three independent experiments. a, vs. BSA-treated group, P < 0.05; b, vs. AGEs or AGEs plus goat IgG, P < 0.05. E: MMECs were pretreated with mouse anti–TGF-β1 neutralizing antibody or mouse IgG for 30 min and then cultured in the presence of AGEs for 30 min. Immunoprecipitation/Western blotting demonstrated Smad3 Smad3 phosphorylation and total Smad3 in MMECs. F: MMECs were pretreated with control siRNA or TGF-β receptor 1 siRNA for 2 days and then cultured in the presence of AGEs for 30 min. Immunoprecipitation/Western blotting demonstrated TGF-β receptor 1, GAPDH, p-Smad3, and total Smad3 in MMECs.
FIG. 6.
SIS3 inhibited AGE-induced activation of Smad3 and EndoMT in MMECs. MMECs were pretreated with 1 μmol/l SIS3 or DMSO for 30 min and then cultured in the presence of 25 μg/ml AGEs for 30 min or 7 days. Immunoprecipitation/Western blotting demonstrated Smad3 phosphorylation (p-Smad3), Smad3, p-Smad2, and Smad2 at 30 min after AGEs stimulation in the presence of SIS3 (A). Confocal microscopy demonstrated the expression of VE-cadherin (green), α-SMA (red), and DAPI (blue) 7 days after incubation with BSA (C), AGEs plus DMSO (D), and AGEs plus SIS3 (E) in MMECs. Arrows indicate VE-Cadherin+/α-SMA+ cells. B: Quantitation of percentages of α-SMA– and VE-cadherin–positive cells in total DAPI-positive cells. a, vs. BSA-treated group or AGEs plus SIS3–treated group, P < 0.05. Original magnification 600×. F and G: MMECs were pretreated with control siRNA (CTL siRNA), Smad2 siRNA, or Smad3 siRNA for 2 days and then cultured in the presence of AGEs or BSA for 24 h. Western blotting demonstrated Smad2, Smad3, and GAPDH in MMECs (F), and real-time PCR showed α-SMA mRNA levels in MMECs (G). b, vs. BSA, P < 0.05. c, vs. BSA, P < 0.05. (A high-quality digital representation of this figure is available in the online issue.)
FIG. 7.
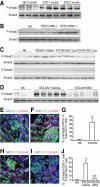
SIS3 inhibited Smad3 activation in STZ-induced diabetic nephropathy. Immunoprecipitation/Western blotting demonstrated the time course of phosphorylated Smad3 (p-Smad3) and total levels of Smad3 in STZ-induced diabetic mouse kidneys and normal saline (NS)-treated kidneys (A) and p-Smad3 and total Smad3 in normal saline-treated, STZ-injected nondiabetic (STZ+/DM−) and STZ-injected diabetic (STZ+/DM+) mouse kidneys (B). C: One month after the onset of STZ-induced diabetes or normal saline treatment, diabetic mice were given intraperitoneal injection of vehicle and different dosages of SIS3. Immunoprecipitation/Western blotting demonstrated p-Smad3, total Smad3, p-Smad2, and total Smad2 in kidneys of mice with different treatments. D: Immunoprecipitation/Western blotting demonstrated p-Smad3 and total Smad3 in normal saline-treated mouse kidneys, STZ-induced diabetic nephropathy plus vehicle-treated mouse kidneys, and STZ-induced diabetic nephropathy plus SIS3-treated (2.5 μg · g−1 · day−1) mouse kidneys. Confocal microscopy demonstrated CD31 (green), p-Smad3 (red), and DAPI (blue) staining in 1-month normal saline-treated kidney (E), 1-month STZ-induced diabetic kidney (F), 3-month STZ-induced diabetic nephropathy plus vehicle-treated mouse kidney (H), and 3-month STZ-induced diabetic nephropathy plus SIS3-treated mouse kidney (I). G: Quantitation of percentage of phosporylated Smad3–positive cells in total CD31-positive cells in 1-month normal saline-treated and STZ-injected diabetic kidneys. J: Quantitation of percentage of phosphorylated Smad3–positive cells in total CD31-positive cells in 3-month normal saline-treated and STZ-induced diabetic nephropathy plus vehicle-treated and STZ-induced diabetic nephropathy plus SIS3 treated kidneys. a, vs. normal saline, P < 0.05; b, vs. STZ-induced diabetic nephropathy plus vehicle-treated kidneys, P < 0.05. Original magnification: C, D, F, and G, 600×. (A high-quality digital representation of this figure is available in the online issue.)
FIG. 8.
SIS3 inhibited AGE-induced EndoMT in Tie2-Cre;Loxp-EGFP mice. Confocal microscopy demonstrated EGFP (green), α-SMA (red), and DAPI (blue) staining in MSA-treated (A), AGEs plus vehicle–treated (B–F), and AGEs plus SIS3–treated (G) mouse kidneys. Arrows indicate EGFP+/α-SMA+ cells in an AGEs plus vehicle–treated kidney (seen at higher magnification in C–F). Original magnification: A, B, G, 600×; C–F, 1,200×. Quantification of percentage of α-SMA+/EGFP+ cells in total α-SMA+ cells in MSA-treated, AGEs plus vehicle–treated, and AGEs plus SIS3–treated mouse kidneys (H). a, vs. MSA-treated group, P < 0.05; b, vs. AGES plus vehicle–treated group, P < 0.05. (A high-quality digital representation of this figure is available in the online issue.)
FIG. 9.
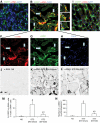
SIS3 reduced EndoMT in STZ-induced diabetic nephropathy (DN) in Tie2-Cre;Loxp-EGFP mice. Confocal microscopy demonstrated EGFP (green), α-SMA (red), and DAPI (blue) in normal saline-treated kidney (A), STZ-induced diabetic nephropathy plus vehicle kidney (B–H), and STZ-induced diabetic nephropathy plus SIS3 mouse kidney (I). Arrows indicate EGFP+/α-SMA+ cells that are enlarged in C–E. F: α-SMA (red). G: EGFP (green). H: DAPI (blue). B: merged. Confocal microscopy demonstrated α-SMA staining in normal saline (NS)-treated (J), STZ-induced diabetic nephropathy plus vehicle-treated (K), and STZ-induced diabetic nephropathy plus SIS3-treated (L) mouse kidneys. Quantitation of percentage of EGFP+/α-SMA+ cells in total α-SMA+ cells (M) and total number of α-SMA+ myofibroblasts in normal saline, STZ-induced diabetic nephropathy plus vehicle and STZ-induced diabetic nephropathy plus SIS3 mouse kidneys (N). a, vs. normal saline, P < 0.05; b, vs. STZ-induced diabetic nephropathy plus vehicle, P < 0.05. Original magnification: A, B, F–K, 600×; C–E, 1,200×. (A high-quality digital representation of this figure is available in the online issue.)
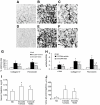
FIG. 10.
SIS3 reduces renal fibrosis in diabetic nephropathy. Confocal microscopy demonstrated collagen IV (A–C) and fibronectin (D–F) immunostaining in normal saline (NS)-treated (A and D), STZ-induced diabetic nephropathy (STZ-DN) plus vehicle (B and E), and STZ-induced diabetic nephropathy) plus SIS3 (C and F) mouse kidneys. Original magnification 600×. G: Quantification of collagen IV and fibronectin staining in normal saline-treated, STZ-induced diabetic nephropathy plus vehicle-treated, and STZ-induced diabetic nephropathy plus SIS3-treated kidneys. a, vs. normal saline, P < 0.05; b, vs. STZ-diabetic nephropathy plus vehicle, P < 0.05. H: Real-time PCR demonstrated α-SMA, collagen IV, and fibronectin mRNA expression in normal saline, STZ-induced diabetic nephropathy plus vehicle, and STZ-induced diabetic nephropathy plus SIS3 mouse kidneys. c, vs. NS, P < 0.05; d, vs. STZ-induced diabetic nephropathy plus vehicle, P < 0.05. I: Serum creatinine in normal saline, STZ-induced diabetic nephropathy plus vehicle, and STZ-induced diabetic nephropathy plus SIS3 mouse kidneys. e, vs. NS, P < 0.05; f, vs. STZ-induced diabetic nephropathy plus vehicle, P < 0.05. J: Urine albumin/creatinine in normal saline, STZ-induced diabetic nephropathy plus vehicle, and STZ-induced diabetic nephropathy plus SIS3 groups. No significant differences were identified.
Similar articles
- Endothelial-myofibroblast transition contributes to the early development of diabetic renal interstitial fibrosis in streptozotocin-induced diabetic mice.
Li J, Qu X, Bertram JF. Li J, et al. Am J Pathol. 2009 Oct;175(4):1380-8. doi: 10.2353/ajpath.2009.090096. Epub 2009 Sep 3. Am J Pathol. 2009. PMID: 19729486 Free PMC article. - α2-antiplasmin positively regulates endothelial-to-mesenchymal transition and fibrosis progression in diabetic nephropathy.
Kanno Y, Hirota M, Matsuo O, Ozaki KI. Kanno Y, et al. Mol Biol Rep. 2022 Jan;49(1):205-215. doi: 10.1007/s11033-021-06859-z. Epub 2021 Oct 28. Mol Biol Rep. 2022. PMID: 34709571 - FSP1-specific SMAD2 knockout in renal tubular, endothelial, and interstitial cells reduces fibrosis and epithelial-to-mesenchymal transition in murine STZ-induced diabetic nephropathy.
Loeffler I, Liebisch M, Allert S, Kunisch E, Kinne RW, Wolf G. Loeffler I, et al. Cell Tissue Res. 2018 Apr;372(1):115-133. doi: 10.1007/s00441-017-2754-1. Epub 2017 Dec 6. Cell Tissue Res. 2018. PMID: 29209813 - Review: Endothelial-myofibroblast transition, a new player in diabetic renal fibrosis.
Li J, Bertram JF. Li J, et al. Nephrology (Carlton). 2010 Aug;15(5):507-12. doi: 10.1111/j.1440-1797.2010.01319.x. Nephrology (Carlton). 2010. PMID: 20649869 Review. - Role of AGEs in diabetic nephropathy.
Fukami K, Yamagishi S, Ueda S, Okuda S. Fukami K, et al. Curr Pharm Des. 2008;14(10):946-52. doi: 10.2174/138161208784139710. Curr Pharm Des. 2008. PMID: 18473844 Review.
Cited by
- Regulation of RAGE for attenuating progression of diabetic vascular complications.
Win MT, Yamamoto Y, Munesue S, Saito H, Han D, Motoyoshi S, Kamal T, Ohara T, Watanabe T, Yamamoto H. Win MT, et al. Exp Diabetes Res. 2012;2012:894605. doi: 10.1155/2012/894605. Epub 2011 Oct 29. Exp Diabetes Res. 2012. PMID: 22110482 Free PMC article. Review. - In Pulmonary Arterial Hypertension, Reduced BMPR2 Promotes Endothelial-to-Mesenchymal Transition via HMGA1 and Its Target Slug.
Hopper RK, Moonen JR, Diebold I, Cao A, Rhodes CJ, Tojais NF, Hennigs JK, Gu M, Wang L, Rabinovitch M. Hopper RK, et al. Circulation. 2016 May 3;133(18):1783-94. doi: 10.1161/CIRCULATIONAHA.115.020617. Epub 2016 Apr 4. Circulation. 2016. PMID: 27045138 Free PMC article. - Endothelial-Mesenchymal Transition in Regenerative Medicine.
Medici D. Medici D. Stem Cells Int. 2016;2016:6962801. doi: 10.1155/2016/6962801. Epub 2016 Apr 7. Stem Cells Int. 2016. PMID: 27143978 Free PMC article. Review. - Podocyte and endothelial-specific elimination of BAMBI identifies differential transforming growth factor-β pathways contributing to diabetic glomerulopathy.
Lai H, Chen A, Cai H, Fu J, Salem F, Li Y, He JC, Schlondorff D, Lee K. Lai H, et al. Kidney Int. 2020 Sep;98(3):601-614. doi: 10.1016/j.kint.2020.03.036. Epub 2020 Apr 26. Kidney Int. 2020. PMID: 32739209 Free PMC article. - Cytokine mediated tissue fibrosis.
Borthwick LA, Wynn TA, Fisher AJ. Borthwick LA, et al. Biochim Biophys Acta. 2013 Jul;1832(7):1049-60. doi: 10.1016/j.bbadis.2012.09.014. Epub 2012 Oct 6. Biochim Biophys Acta. 2013. PMID: 23046809 Free PMC article. Review.
References
- Lewis EJ, Hunsicker LG, Bain RP, Rohde RD. The effect of angiotensin-converting-enzyme inhibition on diabetic nephropathy. N Engl J Med 1993;329:1456–1462 - PubMed
- Lewis EJ, Hunsicker LG, Clarke WR, Berl T, Pohl MA, Lewis JB, Ritz E, Atkins RC, Rohde R, Raz I. the Collaborative Study Group Renoprotective effect of the angiotensin-receptor antagonist irbesartan in patients with nephropathy due to type 2 diabetes. N Engl J Med 2001;345:851–860 - PubMed
- Brenner BM, Cooper ME, de Zeeuw D, Berl T, Pohl MA, Lewis JB, Ritz E, Atkins RC, Rohde R, Raz I. the Collaborative Study Group Effects of losartan on renal and cardiovascular outcomes in patients with type 2 diabetes and nephropathy. N Engl J Med 2001;345:861–869 - PubMed
Publication types
MeSH terms
Substances
LinkOut - more resources
Full Text Sources
Other Literature Sources
Medical
Molecular Biology Databases
Miscellaneous
