Cloud-scale RNA-sequencing differential expression analysis with Myrna - PubMed (original) (raw)
Cloud-scale RNA-sequencing differential expression analysis with Myrna
Ben Langmead et al. Genome Biol. 2010.
Abstract
As sequencing throughput approaches dozens of gigabases per day, there is a growing need for efficient software for analysis of transcriptome sequencing (RNA-Seq) data. Myrna is a cloud-computing pipeline for calculating differential gene expression in large RNA-Seq datasets. We apply Myrna to the analysis of publicly available data sets and assess the goodness of fit of standard statistical models. Myrna is available from http://bowtie-bio.sf.net/myrna.
Figures
Figure 1
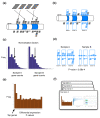
The Myrna pipeline. (a) Reads are aligned to the genome using a parallel version of Bowtie. (b) Reads are aggregated into counts for each genomic feature - for example, for each gene in the annotation files. (c) For each sample a normalization constant is calculated based on a summary of the count distribution. (d) Statistical models are used to calculate differential expression in the R programming language parallelized across multiple processors. (e) Significance summaries such as _P_-values and gene-specific counts are calculated and returned. (f) Myrna also returns publication ready coverage plots for differentially expressed genes.
Figure 2
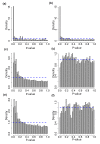
Hapmap results. Histograms of _P_-values from six different analysis strategies applied to randomly labeled samples. In each case the _P_-values should be uniformly distributed (blue dotted line) since the labels are randomly assigned. (a) Poisson model, 75th percentile normalization. (b) Poisson model, 75th percentile included as term. (c) Gaussian model, 75th percentile normalization. (d) Gaussian model, 75th percentile included as term. (e) Permutation model, 75th percentile normalization. (f) Permutation model, 75th percentile included as term.
Figure 3
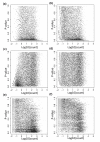
Hapmap _P_-values versus read depth. A plot of _P_-value versus the log base 10 of the average count for each gene using the six different analysis strategies applied to randomly labeled samples. In each case the _P_-values should be uniformly distributed between zero and one. (a) Poisson model, 75th percentile normalization. (b) Poisson model, 75th percentile included as term. (c) Gaussian model, 75th percentile normalization. (d) Gaussian model, 75th percentile included as term. (e) Permutation model, 75th percentile normalization. (f) Permutation model, 75th percentile included as term.
Figure 4
Scalability of Myrna. Number of worker CPU cores allocated from EC2 versus throughput measured in experiments per hour: that is, the reciprocal of the wall clock time required to conduct a whole-human experiment on the 1.1 billion read Pickrell et al. dataset [32]. The line labeled 'linear speedup' traces hypothetical linear speedup relative to the throughput for 80 processor cores.
Similar articles
- SPARTA: Simple Program for Automated reference-based bacterial RNA-seq Transcriptome Analysis.
Johnson BK, Scholz MB, Teal TK, Abramovitch RB. Johnson BK, et al. BMC Bioinformatics. 2016 Feb 4;17:66. doi: 10.1186/s12859-016-0923-y. BMC Bioinformatics. 2016. PMID: 26847232 Free PMC article. - RNA CoMPASS: a dual approach for pathogen and host transcriptome analysis of RNA-seq datasets.
Xu G, Strong MJ, Lacey MR, Baribault C, Flemington EK, Taylor CM. Xu G, et al. PLoS One. 2014 Feb 25;9(2):e89445. doi: 10.1371/journal.pone.0089445. eCollection 2014. PLoS One. 2014. PMID: 24586784 Free PMC article. - A pipeline for RNA-seq data processing and quality assessment.
Goncalves A, Tikhonov A, Brazma A, Kapushesky M. Goncalves A, et al. Bioinformatics. 2011 Mar 15;27(6):867-9. doi: 10.1093/bioinformatics/btr012. Epub 2011 Jan 13. Bioinformatics. 2011. PMID: 21233166 Free PMC article. - Differential Expression Analysis of RNA-seq Reads: Overview, Taxonomy, and Tools.
Chowdhury HA, Bhattacharyya DK, Kalita JK. Chowdhury HA, et al. IEEE/ACM Trans Comput Biol Bioinform. 2020 Mar-Apr;17(2):566-586. doi: 10.1109/TCBB.2018.2873010. Epub 2018 Oct 1. IEEE/ACM Trans Comput Biol Bioinform. 2020. PMID: 30281477 Review. - From RNA-seq reads to differential expression results.
Oshlack A, Robinson MD, Young MD. Oshlack A, et al. Genome Biol. 2010;11(12):220. doi: 10.1186/gb-2010-11-12-220. Epub 2010 Dec 22. Genome Biol. 2010. PMID: 21176179 Free PMC article. Review.
Cited by
- Transcriptome-Powered Pluripotent Stem Cell Differentiation for Regenerative Medicine.
Ogi DA, Jin S. Ogi DA, et al. Cells. 2023 May 22;12(10):1442. doi: 10.3390/cells12101442. Cells. 2023. PMID: 37408278 Free PMC article. Review. - Temporal progress of gene expression analysis with RNA-Seq data: A review on the relationship between computational methods.
Costa-Silva J, Domingues DS, Menotti D, Hungria M, Lopes FM. Costa-Silva J, et al. Comput Struct Biotechnol J. 2022 Dec 1;21:86-98. doi: 10.1016/j.csbj.2022.11.051. eCollection 2023. Comput Struct Biotechnol J. 2022. PMID: 36514333 Free PMC article. Review. - GeneCloudOmics: A Data Analytic Cloud Platform for High-Throughput Gene Expression Analysis.
Helmy M, Agrawal R, Ali J, Soudy M, Bui TT, Selvarajoo K. Helmy M, et al. Front Bioinform. 2021 Nov 25;1:693836. doi: 10.3389/fbinf.2021.693836. eCollection 2021. Front Bioinform. 2021. PMID: 36303746 Free PMC article. - Proteomic alteration of endometrial tissues during secretion in polycystic ovary syndrome may affect endometrial receptivity.
Li J, Jiang X, Li C, Che H, Ling L, Wei Z. Li J, et al. Clin Proteomics. 2022 May 28;19(1):19. doi: 10.1186/s12014-022-09353-1. Clin Proteomics. 2022. PMID: 35643455 Free PMC article. - RGMQL: scalable and interoperable computing of heterogeneous omics big data and metadata in R/Bioconductor.
Pallotta S, Cascianelli S, Masseroli M. Pallotta S, et al. BMC Bioinformatics. 2022 Apr 7;23(1):123. doi: 10.1186/s12859-022-04648-4. BMC Bioinformatics. 2022. PMID: 35392801 Free PMC article.
References
Publication types
MeSH terms
LinkOut - more resources
Full Text Sources
Research Materials


