An alternative splicing network links cell-cycle control to apoptosis - PubMed (original) (raw)
An alternative splicing network links cell-cycle control to apoptosis
Michael J Moore et al. Cell. 2010.
Abstract
Alternative splicing is a vast source of biological regulation and diversity that is misregulated in cancer and other diseases. To investigate global control of alternative splicing in human cells, we analyzed splicing of mRNAs encoding Bcl2 family apoptosis factors in a genome-wide siRNA screen. The screen identified many regulators of Bcl-x and Mcl1 splicing, notably an extensive network of cell-cycle factors linked to aurora kinase A. Drugs or siRNAs that induce mitotic arrest promote proapoptotic splicing of Bcl-x, Mcl1, and caspase-9 and alter splicing of other apoptotic transcripts. This response precedes mitotic arrest, indicating coordinated upregulation of prodeath splice variants that promotes apoptosis in arrested cells. These shifts correspond to posttranslational turnover of splicing regulator ASF/SF2, which directly binds and regulates these target mRNAs and globally regulates apoptosis. Broadly, our results reveal an alternative splicing network linking cell-cycle control to apoptosis.
Copyright 2010 Elsevier Inc. All rights reserved.
Figures
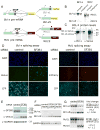
Figure 1. Bcl-x and Mcl1 alternative splicing reporters
(A) Bcl-x and Mcl1 minigene splicing reporters are schematized. Green rectangles are exons, with dark gray as alternative regions. Black lines depict introns. Large arrows denote translation start sites, and arrowheads show primer sets used for qPCR. Inserted PTCs, exclusive to long (L) isoforms, are shown by red ‘stop signs.’ (B) Minigene constructs are spliced like endogenous mRNAs. Splice isoforms from minigene- or mock-transfected (endogenous) HeLa cells were analyzed by RT-PCR with primer sets from (A). Due to high transient minigene expression, cDNA from minigene samples was diluted 1:105 relative to mock (endogenous). At this dilution, endogenous mRNAs do not contribute to products in the ‘minigene’ lanes. (C) A PTC introduced to the alternative exon region eliminated Bcl-xL-Venus but not Bcl-xS-Venus protein expression. HeLa cells were transfected with _Bcl-x_-Venus (PTC-) or Bcl-x-Venus-PTC (PTC+) constructs, and lysates were analyzed by Western with indicated antibodies. Migration of isoforms is indicated to the left of images (last two lanes overexposed to show Bcl-xS-Venus). (D) SF3B1 knockdown activated pro-apoptotic splicing of Bcl-x and Mcl1 reporters. Stable reporter lines were transfected with SF3B1 or non-targeting siRNA pools and imaged in the indicated channels. SF3B1 knockdown increased minigene expression versus controls in both cases. SF3B1 depletion also decreased CFP modestly, possibly reflecting a role in splicing the EF1α intron. Subsequent experiments showed this effect on CFP expression was restricted to SF3B1 (see Figures S2B, S2F). (E) Upregulation of Bcl-xS by SF3B1 depletion was confirmed by Western analysis. Lysates from cells treated as in (D) were analyzed with antibodies indicated to the left of images. SF3B1-knockdown depleted SF3B1 and increased Bcl-xS-Venus relative to controls. (F) Results in (D) and (E) were verified at the RNA level by RT-PCR. Migration of Bcl-xS, Bcl-xL (PTC causes nonsense-mediated decay), and GAPDH (loading control) are indicated to left of images. (G) Results in (D), (E), and (F) model the regulation of endogenous Bcl-x and Mcl1 mRNAs. Unmodified HeLa cells were transfected with SF3B1 or control siRNAs. RT-PCR analysis confirmed that SF3B1 knockdown favored short, pro-apoptotic forms. S/L ratios are quantified to the right of images; values are the mean of 3 independent measurements +/− SD, normalized to controls.
Figure 2. Whole-genome siRNA screen for regulators of Bcl-x alternative splicing
(A) Screening, analysis, and hit-selection are schematized. Of 369 primary hits, 274 re-validated. The pie chart indicates how many of 274 validated hits re-confirmed with 1, 2, 3, or 4 siRNAs. 160 ‘high-confidence’ hits validated with 2 or more siRNAs (see Supplementary Data for complete analysis methods). (B) SVM probability scores are plotted for the whole-genome siRNA screen: confidence on the x-axis, strength on the y-axis. The blue region shows the SVM cut-off for hit selection (see Figures S1–S3 and Tables S1, S2 for detailed analysis and validation). (C) GO functional enrichments from primary, re-validated (1 or more siRNA), and high-confidence (2 or more siRNAs) hits are shown, plotted by relative statistical significance.
Figure 3. Apoptosis inhibition by Bcl2 suppressed a subset of Bcl-x regulators
(A) Screen hits (lightning bolts) may affect Bcl-x AS by many potential mechanisms. Regulation may be direct, such as (1) direct suppression of Bcl-xS formation or (2) facilitation of Bcl-xL. Indirect or downstream regulators may (3) promote cell survival pathways or (4) suppress pro-apoptotic pathways. We predicted that Bcl2 overexpression would suppress the splicing regulatory effect of siRNAs targeting indirect mechanisms, but not direct regulators. (B) Bcl2 overexpression did not suppress the effect of SF3B1 depletion, consistent with direct regulation of Bcl-x splicing. (C) Bcl2 suppressed the effect of siRNAs against mRNA export factors NXF1 and NUPL2, but not AURKA, on Bcl-x splicing (compare Venus images between ‘wild-type’ and ‘Bcl2 overexpression’). By contrast, Bcl2 suppressed cell death in all cases (compare DAPI images). (D) 33% were suppressed by Bcl2 overexpression, while 67% showed partial to no suppression. GO functional enrichments within these subsets are shown with p-values (see Table S3).
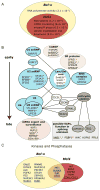
Figure 4. Coordinated regulation of Bcl-x and Mcl1 alternative splicing
(A) Bcl-x screen hits were tested for Mcl1 regulation to identify common regulators. High confidence hits are depicted as a Venn Diagram, with GO enrichments listed with p-values in the subsets where they were most significantly enriched (see Figure S4 and Table S4). (B) Spliceosome-associated proteins that were Bcl-x screen hits are shown with established physical interactions and functional roles. Blue ellipses represent known RNP or protein complexes; pink ellipses contain functionally or structurally related factors. Low-confidence hits are italicized. Factors in gray rectangle have unknown roles in splicing, but were identified in proteomic analyses or are similar to known splicing factors (Chen et al., 2007). Factors are marked as follows: * = high-confidence hit for Mcl1; underlined = phosphorylated in mitosis; + = putative AURKA target; x = putative CDK1 target; # = putative PLK1 target (Dephoure et al., 2008). (C) Hits from a kinase/phosphatase screen for Mcl1 splicing regulation are shown, with corresponding Bcl-x regulators. A cutoff of p<10−5 in three replicates, or p<10−7 in two replicates was applied (see Table S5). Cell cycle factors are underlined.
Figure 5. Alternative splicing regulation is coupled to cell cycle control
(A) Screen hits span an AURKA-centered protein interaction network. Circles (‘nodes’) depict proteins, connected by lines (‘edges’) representing validated protein-protein interactions. A maximum of two non-hit bridges was permitted to connect hits to AURKA, as described in Supplemental Data. (B) Drugs disrupting the cell-cycle promote pro-apoptotic Bcl-x AS. Bcl-x reporter cells were treated with nocodazole, aurora inhibitors VX-680 or ZM447439, or staurosporine for 18 hours. 3-fold dilution series were tested with the following maximum concentrations: 200 nM nocodazole, 10 μM VX-680, 30 μM ZM447439, 33nM staurosporine. %-Venus-positive values for drug treatments were normalized to DMSO-treatments; plotted values reflect means of 8–12 measurements +/− SD. Nocodazole, VX-680, and ZM447439, but not staurosporine, caused significant pro-apoptotic shifts in Bcl-x splicing (p<0.001). LD50 ranges derived from cell counts are shown below the x-axis. Wells with >33nM staurosporine had >95% death, so they were not quantified (see Figure S5). (C) Aurora inhibitors induced mitotic arrest coupled with pro-apoptotic Bcl-x splicing. Bcl-x reporter cells were treated with 3 μM VX-680, 10 μM ZM447439 or DMSO, stained with propidium iodide, and analyzed for DNA content and Venus fluorescence by flow cytometry. (D) Asynchronous, actively cycling cells from (C) show little to no Bcl-x splicing fluctuations relative to arrested cells. (E) S-phase arrest by double thymidine block did not alter Bcl-x splicing, indicating specificity for mitotic arrest. Cells were analyzed as in (C). (F) Bcl-x splicing regulation precedes mitotic arrest. Asynchronous or thymidine-synchronized cells from (E) were treated with the indicated inhibitors or DMSO. Cells were analyzed by automated microscopy 16 hours after thymidine release, precluding an intervening round of mitosis for synchronized cells. The response in pre-synchronized cells confirms a splicing shift upstream of mitotic arrest.
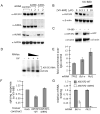
Figure 6. ASF/SF2 regulates splicing downstream of AURKA
(A) siRNA depletion of AURKA downregulated ASF/SF2. Cells were transfected with two different siRNAs for AURKA or AURKB, or control siRNAs. Lysates were analyzed by Western analysis for indicated factors. No other splicing factors measured in these samples showed significant changes (Figure S6A), indicating specificity for ASF/SF2. (B) VX-680 treatment downregulated ASF/SF2 in a dose dependent manner. (C) ASF/SF2 is downregulated post-translationally upon AURKA inhibition (see also Figure S6B). HeLa cells were transfected with a GFP-ASF/SF2 construct, then treated with VX-680 or DMSO. Western analysis showed that VX-680 downregulated exogenous ASF/SF2, indicating post-translational turnover. ASF/SF2 downregulation also occurred in apoptosis-resistant cells over-expressing Bcl2 (see Figures S6C). (D) Visualization of ASF/SF2-RNA complexes by CLIP is shown. RNP complexes were UV-cross-linked in live HeLa cells, ASF/SF2 was immunopurified, and RNA was end-labeled with γ-32P-ATP. Complexes were run on SDS-PAGE and visualized by autoradiography. Non-cross-linked ASF/SF2 (UV- lane) was also labeled, as observed in Sanford et al., 2009. (E) ASF/SF2 directly binds Bcl-x and Mcl1 mRNAs. RT-PCR analysis of ASF/SF2-bound RNAs showed significant enrichment of Bcl-x, Mcl1, and known target TPX2 versus an irrelevant IgG control. (F) Exogenous expression of ASF/SF2 attenuated the effect of AURKA inhibition on Bcl-x splicing. Bcl-x reporter cells were transfected with mCherry-tagged ASF/SF2, a mutant lacking the second RRM domain (ΔRRM2), or mCherry alone. 18 hours post-transfection, cells were treated with 3 μm VX-680 or DMSO for 24 hours. The fraction of Venus-positive cells among mCherry-positive cells was determined by automated microscopy. VX-680-treated samples were background-corrected by subtracting values from DMSO treatment. Values are means of 3 separate measurements +/− SD, expressed relative to the mCherry-transfected control. ASF/SF2-WT attenuated the Bcl-x response to VX-680 by ~50% versus ΔRRM2. CFP expression was not affected, indicating specific attenuation of Bcl-x splicing. (G) ASF/SF2-ΔRRM2 shows deficient association with Bcl-x and Mcl1 mRNAs. CLIP analysis of exogenous, GFP-tagged ASF/SF2-WT or - ΔRRM2 was performed with α-GFP antisera.
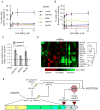
Figure 7. An apoptotic alternative splicing program linked to cell cycle control
(A) ASF/SF2 downregulation triggers apoptosis, and sensitizes cells to apoptosis induction by AURKA inhibition. HeLa cells were transfected with indicated siRNAs, incubated to allow factor depletion, then treated with varying concentrations of VX-680. Apoptosis was measured via cleavage of a fluorescent caspase-3 substrate. Depletion of ASF/SF2, but not SRPK1, SNRP70, or Sam68, sensitized cells to VX-680-induced apoptosis. This selective sensitization by ASF/SF2 depletion was not observed for staurosporine-induced apoptosis (see Figure S6D). Data reflect means of 3 independent transfections +/− SDs. (B) Analysis in (A) was repeated using Annexin-V staining as the apoptosis marker. (C) CASP9 and CASP2 AS were analyzed in HeLa cells by qPCR following transfection with the indicated siRNAs. Relative levels of pro-apoptotic isoform (L) normalized to negative controls are shown. Values are means of 3 independent measurements +/− SD. (D) Results of AS profiling by real-time qPCR are shown in a heat-map of _z-_scores averaged across four biological replicates, along with unsupervised hierarchical clustering (see Figure S7 for an expanded view and validation of this data). (E) A model of cell cycle arrest coupled to apoptosis via AS is shown. We propose anticipatory, pro-apoptotic splicing decisions in interphase that later promote apoptosis in arrested cells. Lightning bolts represent siRNAs, drugs, or other stimuli that disrupt the cell cycle and promote pro-apoptotic splicing of Bcl-x, Mcl1, CASP9, and other targets.
Similar articles
- Genome-wide RNAi screen discovers functional coupling of alternative splicing and cell cycle control to apoptosis regulation.
Wang Q, Silver PA. Wang Q, et al. Cell Cycle. 2010 Nov 15;9(22):4419-21. doi: 10.4161/cc.9.22.14051. Epub 2010 Nov 15. Cell Cycle. 2010. PMID: 21088477 Free PMC article. No abstract available. - MicroRNA (miRNA)-mediated interaction between leukemia/lymphoma-related factor (LRF) and alternative splicing factor/splicing factor 2 (ASF/SF2) affects mouse embryonic fibroblast senescence and apoptosis.
Verduci L, Simili M, Rizzo M, Mercatanti A, Evangelista M, Mariani L, Rainaldi G, Pitto L. Verduci L, et al. J Biol Chem. 2010 Dec 10;285(50):39551-63. doi: 10.1074/jbc.M110.114736. Epub 2010 Oct 4. J Biol Chem. 2010. PMID: 20923760 Free PMC article. - The RNA-binding protein Sam68 modulates the alternative splicing of Bcl-x.
Paronetto MP, Achsel T, Massiello A, Chalfant CE, Sette C. Paronetto MP, et al. J Cell Biol. 2007 Mar 26;176(7):929-39. doi: 10.1083/jcb.200701005. Epub 2007 Mar 19. J Cell Biol. 2007. PMID: 17371836 Free PMC article. - My road to alternative splicing control: from simple paths to loops and interconnections.
Chabot B. Chabot B. Biochem Cell Biol. 2015 Jun;93(3):171-9. doi: 10.1139/bcb-2014-0161. Epub 2015 Feb 12. Biochem Cell Biol. 2015. PMID: 25759250 Review. - Alternative splicing of Bcl-2-related genes: functional consequences and potential therapeutic applications.
Akgul C, Moulding DA, Edwards SW. Akgul C, et al. Cell Mol Life Sci. 2004 Sep;61(17):2189-99. doi: 10.1007/s00018-004-4001-7. Cell Mol Life Sci. 2004. PMID: 15338051 Free PMC article. Review.
Cited by
- Recent Advances in Drug Discovery for Triple-Negative Breast Cancer Treatment.
Masci D, Naro C, Puxeddu M, Urbani A, Sette C, La Regina G, Silvestri R. Masci D, et al. Molecules. 2023 Nov 9;28(22):7513. doi: 10.3390/molecules28227513. Molecules. 2023. PMID: 38005235 Free PMC article. Review. - Disruption of the VDAC2-Bak interaction by Bcl-x(S) mediates efficient induction of apoptosis in melanoma cells.
Plötz M, Gillissen B, Hossini AM, Daniel PT, Eberle J. Plötz M, et al. Cell Death Differ. 2012 Dec;19(12):1928-38. doi: 10.1038/cdd.2012.71. Epub 2012 Jun 15. Cell Death Differ. 2012. PMID: 22705850 Free PMC article. - Genome-Wide RNAi Screening Identifies Novel Pathways/Genes Involved in Oxidative Stress and Repurposable Drugs to Preserve Cystic Fibrosis Airway Epithelial Cell Integrity.
Checa J, Martínez-González I, Maqueda M, Mosquera JL, Aran JM. Checa J, et al. Antioxidants (Basel). 2021 Dec 2;10(12):1936. doi: 10.3390/antiox10121936. Antioxidants (Basel). 2021. PMID: 34943039 Free PMC article. - Analysis of Genome-Wide Alternative Splicing Profiling and Development of Potential Drugs in Lung Adenocarcinoma.
Song J, Liu J, Lv D, Meng X, Li X. Song J, et al. Front Genet. 2021 Oct 19;12:767259. doi: 10.3389/fgene.2021.767259. eCollection 2021. Front Genet. 2021. PMID: 34737768 Free PMC article. - Quantitative phosphoproteomics identifies substrates and functional modules of Aurora and Polo-like kinase activities in mitotic cells.
Kettenbach AN, Schweppe DK, Faherty BK, Pechenick D, Pletnev AA, Gerber SA. Kettenbach AN, et al. Sci Signal. 2011 Jun 28;4(179):rs5. doi: 10.1126/scisignal.2001497. Sci Signal. 2011. PMID: 21712546 Free PMC article.
References
- Björklund M, Taipale M, Varjosalo M, Saharinen J, Lahdenperä J, Taipale J. Identification of pathways regulating cell size and cell-cycle progression by RNAi. Nature. 2006;439:1009–1013. - PubMed
- Black DL. Mechanisms of alternative pre-messenger RNA splicing. Annu Rev Biochem. 2003;72:291–336. - PubMed
- Blencowe BJ. Alternative splicing: new insights from global analyses. Cell. 2006;14:37–47. - PubMed
Publication types
MeSH terms
Substances
LinkOut - more resources
Full Text Sources
Other Literature Sources
Molecular Biology Databases
Research Materials


