Adiponectin-induced ERK and Akt phosphorylation protects against pancreatic beta cell apoptosis and increases insulin gene expression and secretion - PubMed (original) (raw)
Adiponectin-induced ERK and Akt phosphorylation protects against pancreatic beta cell apoptosis and increases insulin gene expression and secretion
Nadeeja Wijesekara et al. J Biol Chem. 2010.
Abstract
The functional impact of adiponectin on pancreatic beta cells is so far poorly understood. Although adiponectin receptors (AdipoR1/2) were identified, their involvement in adiponectin-induced signaling and other molecules involved is not clearly defined. Therefore, we investigated the role of adiponectin in beta cells and the signaling mediators involved. MIN6 beta cells and mouse islets were stimulated with globular (2.5 μg/ml) or full-length (5 μg/ml) adiponectin under serum starvation, and cell viability, proliferation, apoptosis, insulin gene expression, and secretion were measured. Lysates were subjected to Western blot analysis to determine phosphorylation of AMP-activated protein kinase (AMPK), Akt, or ERK. Functional significance of signaling was confirmed using dominant negative mutants or pharmacological inhibitors. Participation of AdipoRs was assessed by overexpression or siRNA. Adiponectin failed to activate AMPK after 10 min or 1- and 24-h stimulation. ERK was significantly phosphorylated after 24-h treatment with adiponectin, whereas Akt was activated at all time points examined. 24-h stimulation with adiponectin significantly increased cell viability by decreasing cellular apoptosis, and this was prevented by dominant negative Akt, wortmannin (PI3K inhibitor), and U0126 (MEK inhibitor). Moreover, adiponectin regulated insulin gene expression and glucose-stimulated insulin secretion, which was also prevented by wortmannin and U0126 treatment. Interestingly, the data also suggest adiponectin-induced changes in Akt and ERK phosphorylation and caspase-3 may occur independent of the level of AdipoR expression. This study demonstrates a lack of AMPK involvement and implicates Akt and ERK in adiponectin signaling, leading to protection against apoptosis and stimulation of insulin gene expression and secretion in pancreatic beta cells.
Figures
FIGURE 1.
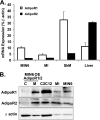
AdipoR expression in pancreatic islets and beta cells. A, qPCR analysis of AdipoR1 and 2 transcripts in MIN6 cells, mouse islets (MI), skeletal muscle (SkM), and liver. B, Western blot analysis of AdipoR1 and 2 (46 kDa) in cytosolic (C) and membrane (M) fractions of MIN6 cells overexpressing (OE) AdipoR1 or 2 and in total lysates of C2C12 myocytes, mouse islets and MIN6 cells. β-Actin (43 kDa) was used as a loading control.
FIGURE 2.
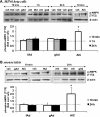
Adiponectin-induced AMPK phosphorylation in MIN6 cells (A) and mouse islets (B). Cells were stimulated with or without 2.5 μg/ml gAd, 5 μg/ml fAd, or 2 m
m
AICAR (AIC) for 10 min, 1 h, or 24 h, in serum-free medium. PBS or 5 m
m
Tris-HCl was used as a control (veh). Representative Western blots of phospho-AMPK (Thr172) (62 kDa) and β-actin (43 kDa) are shown. Quantified values represent means ± S.E. of three or four experiments and are normalized to β-actin and control. *, p < 0.05 versus the respective control.
FIGURE 3.
Adiponectin-induced Akt phosphorylation in MIN6 cells (A and C) and mouse islets (B) in the presence or absence of insulin. Cells were stimulated with or without 2.5 μg/ml gAd, 5 μg/ml fAd, or 100 n
m
insulin (ins) for 10 min, 1 h, or 24 h in serum-free medium. PBS or 5 m
m
Tris-HCl was used as a control (veh). Representative Western blots of phospho-Akt (Ser473) (60 kDa) and β-actin (43 kDa) are shown. Quantified values represent means ± S.E. of three to nine experiments and are normalized to β-actin and control. *, p < 0.05 versus the respective control; #, p < 0.05 versus insulin or fAd alone.
FIGURE 4.
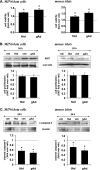
Adiponectin-induced ERK1/2 phosphorylation in MIN6 cells (A) and mouse islets (B). Cells were stimulated with or without 2.5 μg/ml gAd or 5 μg/ml fAd for 10 min, 1 h, or 24 h in serum-free medium. PBS or 5 m
m
Tris-HCl was used as a control (veh). Representative Western blots of phospho-ERK1/2 (Thr202/Tyr204) (42, 44 kDa) and β-actin (43 kDa) are shown. Quantified values (both bands were assessed for phospho-ERK) represent means ± S.E. of three experiments and are normalized to β-actin and control. *, p < 0.05 versus the respective control.
FIGURE 5.
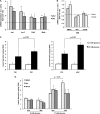
Adiponectin-induced changes in cell viability (A), proliferation (B), and apoptosis (C) in MIN6 cells and mouse islets. Cells were stimulated with or without 2.5 μg/ml gAd or 5 μg/ml fAd for 24 h. PBS or 5 m
m
Tris-HCl was used as a control (veh). A, cell viability assessed by XTT assay and absorbance at 490 nm normalized to total DNA. Representative Western blots of Ki67 (359 kDa) and laminin A/C (Lam A/C) (70 kDa) (B) or cleaved caspase-3 (c-caspase-3) (19 kDa) and β-actin (43-kDa) (C) are shown. Quantified values represent means ± S.E. of three or four experiments and are normalized to laminin A/C or β-actin and control. *, p < 0.05 versus the respective control.
FIGURE 6.
Effect of Akt (A and B) or ERK (C) inhibition on adiponectin-induced protection against apoptosis in MIN6 cells. A, cells expressing DN-Akt or treated with 50 n
m
wortmannin (Wm) (B) or 10 μ
m
U0126 (C) were stimulated with or without 2.5 μg/ml gAd or 5 μg/ml fAd for 24 h. PBS or 5 m
m
Tris-HCl was used as a control (veh). Representative Western blots of cleaved caspase-3 (c-casp-3) (19 kDa) and β-actin (43 kDa) are shown. Quantified values represent means ± S.E. of three to five experiments and are normalized to β-actin and control. *, p < 0.05 versus the respective control.
FIGURE 7.
Adiponectin-induced changes in insulin gene expression and glucose-stimulated insulin secretion from mouse islets (A and C) and MIN6 cells (B and D). Cells were stimulated with or without 2.5 μg/ml gAd or 5 μg/ml fAd for 24 h in serum-free medium. PBS or 5 m
m
Tris-HCl was used as a control (veh). Cells were subjected to qPCR (A and B) for Ins I, Ins II, Pdx-1 and Mafa transcript expression, or insulin secretion (C and D) was measured during a 1-h stimulation with 2.8 or 0 and 20 or 11 m
m
glucose in the presence or absence of 50 n
m
wortmannin (Wm) or 10 μ
m
U0126. Quantified values represent means ± S.E. of four to six experiments and are normalized to β-actin and control (A and B) or DNA (C and D). *, p < 0.05 versus the respective control or DMSO in the presence of glucose and fAd.
FIGURE 8.
Adiponectin-induced signaling in MIN6 cells treated with siRNA against AdipoRs. Cells co-transfected with AdipoR1 and 2 or control siRNA (ConSi) for 72 h were subjected to qPCR (A) or stimulated with or without 2.5 μg/ml gAd or 5 μg/ml fAd for 24 h in serum-free medium (B–D). PBS or 5 m
m
Tris-HCl was used as a control (veh). Representative Western blots of phospho-Akt (Ser473) (60 kDa), phospho-ERK1/2 (Thr202/Tyr204) (42, 44 kDa), cleaved caspase-3 (c-casp-3) (19 kDa), and β-actin (43 kDa) are shown. Quantified values (both bands were assessed for phospho-ERK) represent means ± S.E. of three or four experiments and are normalized to β-actin and control. *, p < 0.05; **, p < 0.01; ***, p < 0.005 versus the respective control.
Similar articles
- Insulin decreases myocardial adiponectin receptor 1 expression via PI3K/Akt and FoxO1 pathway.
Cui XB, Wang C, Li L, Fan D, Zhou Y, Wu D, Cui QH, Fu FY, Wu LL. Cui XB, et al. Cardiovasc Res. 2012 Jan 1;93(1):69-78. doi: 10.1093/cvr/cvr273. Epub 2011 Oct 19. Cardiovasc Res. 2012. PMID: 22012952 - Acylated and unacylated ghrelin promote proliferation and inhibit apoptosis of pancreatic beta-cells and human islets: involvement of 3',5'-cyclic adenosine monophosphate/protein kinase A, extracellular signal-regulated kinase 1/2, and phosphatidyl inositol 3-Kinase/Akt signaling.
Granata R, Settanni F, Biancone L, Trovato L, Nano R, Bertuzzi F, Destefanis S, Annunziata M, Martinetti M, Catapano F, Ghè C, Isgaard J, Papotti M, Ghigo E, Muccioli G. Granata R, et al. Endocrinology. 2007 Feb;148(2):512-29. doi: 10.1210/en.2006-0266. Epub 2006 Oct 26. Endocrinology. 2007. PMID: 17068144 - Adiponectin mediates antiproliferative and apoptotic responses in endometrial carcinoma by the AdipoRs/AMPK pathway.
Zhang L, Wen K, Han X, Liu R, Qu Q. Zhang L, et al. Gynecol Oncol. 2015 May;137(2):311-20. doi: 10.1016/j.ygyno.2015.02.012. Epub 2015 Feb 19. Gynecol Oncol. 2015. PMID: 25703675 - Involvement of P2X receptors in the regulation of insulin secretion, proliferation and survival in mouse pancreatic β-cells.
Ohtani M, Ohura K, Oka T. Ohtani M, et al. Cell Physiol Biochem. 2011;28(2):355-66. doi: 10.1159/000331752. Epub 2011 Aug 16. Cell Physiol Biochem. 2011. PMID: 21865744 - Adiponectin, driver or passenger on the road to insulin sensitivity?
Ye R, Scherer PE. Ye R, et al. Mol Metab. 2013 Apr 19;2(3):133-41. doi: 10.1016/j.molmet.2013.04.001. Mol Metab. 2013. PMID: 24049728 Free PMC article. Review.
Cited by
- Possibility of adiponectin use to improve islet transplantation outcomes.
Sakata N, Yoshimatsu G, Chinen K, Kawakami R, Kodama S. Sakata N, et al. Sci Rep. 2022 Jan 10;12(1):444. doi: 10.1038/s41598-021-04245-0. Sci Rep. 2022. PMID: 35013505 Free PMC article. - Childhood adiposity and risk of type 1 diabetes: A Mendelian randomization study.
Censin JC, Nowak C, Cooper N, Bergsten P, Todd JA, Fall T. Censin JC, et al. PLoS Med. 2017 Aug 1;14(8):e1002362. doi: 10.1371/journal.pmed.1002362. eCollection 2017 Aug. PLoS Med. 2017. PMID: 28763444 Free PMC article. - Targeting Ceramides and Adiponectin Receptors in the Islet of Langerhans for Treating Diabetes.
Li WH. Li WH. Molecules. 2022 Sep 19;27(18):6117. doi: 10.3390/molecules27186117. Molecules. 2022. PMID: 36144859 Free PMC article. Review. - Adipocytes under assault: environmental disruption of adipose physiology.
Regnier SM, Sargis RM. Regnier SM, et al. Biochim Biophys Acta. 2014 Mar;1842(3):520-33. doi: 10.1016/j.bbadis.2013.05.028. Epub 2013 Jun 2. Biochim Biophys Acta. 2014. PMID: 23735214 Free PMC article. Review. - Adipokines in psoriasis: An important link between skin inflammation and metabolic alterations.
Wolk K, Sabat R. Wolk K, et al. Rev Endocr Metab Disord. 2016 Sep;17(3):305-317. doi: 10.1007/s11154-016-9381-0. Rev Endocr Metab Disord. 2016. PMID: 27554109 Review.
References
- Arita Y., Kihara S., Ouchi N., Takahashi M., Maeda K., Miyagawa J., Hotta K., Shimomura I., Nakamura T., Miyaoka K., Kuriyama H., Nishida M., Yamashita S., Okubo K., Matsubara K., Muraguchi M., Ohmoto Y., Funahashi T., Matsuzawa Y. (1999) Biochem. Biophys. Res. Commun. 257, 79–83 - PubMed
- Weyer C., Funahashi T., Tanaka S., Hotta K., Matsuzawa Y., Pratley R. E., Tataranni P. A. (2001) J. Clin. Endocrinol. Metab. 86, 1930–1935 - PubMed
- Kubota N., Terauchi Y., Yamauchi T., Kubota T., Moroi M., Matsui J., Eto K., Yamashita T., Kamon J., Satoh H., Yano W., Froguel P., Nagai R., Kimura S., Kadowaki T., Noda T. (2002) J. Biol. Chem. 277, 25863–25866 - PubMed
- Maeda N., Shimomura I., Kishida K., Nishizawa H., Matsuda M., Nagaretani H., Furuyama N., Kondo H., Takahashi M., Arita Y., Komuro R., Ouchi N., Kihara S., Tochino Y., Okutomi K., Horie M., Takeda S., Aoyama T., Funahashi T., Matsuzawa Y. (2002) Nat. Med. 8, 731–737 - PubMed
- Yamauchi T., Kamon J., Waki H., Imai Y., Shimozawa N., Hioki K., Uchida S., Ito Y., Takakuwa K., Matsui J., Takata M., Eto K., Terauchi Y., Komeda K., Tsunoda M., Murakami K., Ohnishi Y., Naitoh T., Yamamura K., Ueyama Y., Froguel P., Kimura S., Nagai R., Kadowaki T. (2003) J. Biol. Chem. 278, 2461–2468 - PubMed
Publication types
MeSH terms
Substances
LinkOut - more resources
Full Text Sources
Medical
Research Materials
Miscellaneous


