Position-dependent alternative splicing activity revealed by global profiling of alternative splicing events regulated by PTB - PubMed (original) (raw)
. 2010 Sep;17(9):1114-23.
doi: 10.1038/nsmb.1881. Epub 2010 Aug 15.
Affiliations
- PMID: 20711188
- PMCID: PMC2933513
- DOI: 10.1038/nsmb.1881
Position-dependent alternative splicing activity revealed by global profiling of alternative splicing events regulated by PTB
Miriam Llorian et al. Nat Struct Mol Biol. 2010 Sep.
Abstract
To gain global insights into the role of the well-known repressive splicing regulator PTB, we analyzed the consequences of PTB knockdown in HeLa cells using high-density oligonucleotide splice-sensitive microarrays. The major class of identified PTB-regulated splicing event was PTB-repressed cassette exons, but there was also a substantial number of PTB-activated splicing events. PTB-repressed and PTB-activated exons showed a distinct arrangement of motifs with pyrimidine-rich motif enrichment within and upstream of repressed exons but downstream of activated exons. The N-terminal half of PTB was sufficient to activate splicing when recruited downstream of a PTB-activated exon. Moreover, insertion of an upstream pyrimidine tract was sufficient to convert a PTB-activated exon to a PTB-repressed exon. Our results show that PTB, an archetypal splicing repressor, has variable splicing activity that predictably depends upon its binding location with respect to target exons.
Figures
Figure 1. Microarray analysis of PTB/nPTB targets in Hela cells
(a) Western blot of HeLa cells transfected with control or PTB/nPTB siRNAs using the indicated antibodies. Equivalent amounts of control and knockdown samples were loaded together with 1:2, 1:4 and 1:8 dilutions of the control lysate to allow estimation of knockdown efficiency. (b) Schematic representation of the Affymetrix Human Exon-Junction Array. White boxes represent constitutive exons, dark gray box represent alternative spliced exon, dotted lines indicate splicing outcomes. Light and dark bars represent exon-body and exon-junction probesets respectively. (c) Classification of PTB regulated events. Pie charts showing distribution of PTB activated or repressed alternative spliced events, number of events on each situation given in brackets. ME, mutually exclusive exon; Alt. 5′SS, alternative 5′ splice site; Alt. 3′SS, alternative 3′ splice site; Multiple, multiple cassette exon; Alt. start, alternative first exon; Alt. PolyA, alternative polyadenlylation site; unclassified, unassigned/ambiguous splicing events.
Figure 2. PTB regulation of mutually exclusive exons
Diagrams show possible transcripts arising from splicing of mutually exclusive exons in ACTN4, TEAD3, FMNL2, TPM1 and SRGAP1. Flanking constitutive exons are coloured white, PTB repressed exons are black and PTB activated exons are gray. Direction of change predicted by array is indicated by arrows above exons (largest arrow – HIGHEST, smaller arrow – HIGH confidence level). Asterisks indicate TPM1 RT-PCR products digested with PstI and TEAD3 RT-PCR products digested with HinfI. Molecular markers are shown to the left of gels and the identity of bands indicated to the right. Quantitation is shown in Supplementary Fig. 1.
Figure 3. Tissue specificity of PTB-regulated exons
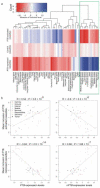
(a) Heat-map of mean tissue-specific exon inclusion profiles for PTB-activated (top), control (middle) and PTB-repressed (bottom) cassette exons across 50 human tissues and cell lines. Note that the major separation is between brain and striated muscles and all remaining tissues. (b) Correlations between relative inclusion levels of PTB-activated (top row) and PTB-repressed (bottom row) cassette exons and transcript levels of PTB (left column) and nPTB (right column). Each point represents the relative inclusion level of PTB-regulated exons in a particular tissue sample. Tissues/cell lines were grouped into 8 coherent groups of tissues, each represented by a different symbol.
Figure 4. Motifs associated with PTB-repressed exons
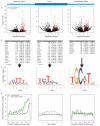
(a) Volcano plots representing log transformed p-values as a function of fold-change for k-mers of 4-7 nt in length. P values and fold changes were derived based on a comparison of PTB-repressed compared to control cassette exons. Plots are shown for the 200 nt upstream flank (left), the exon (center) and 200 nt downstream intron flank (right). K-mers with a pyrimidine content greater than 75% are colored red. The remainder are colored black. Enriched motifs lie in the upper right quadrant. (b) Enriched motifs ranked by P value. (c) Representation of clustered significant motifs using sequence logos, in which the height of a nucleotide at a given position reflects its frequency. (d) Density of known PTB sites, defined as YTCY or YCTY, within the 200 nt upstream intron flank (left), the exon (center) and the 200 nt downstream intron flank (right). In each case the black line represents control cassette exons and the green line PTB-repressed cassette exons.
Figure 5. Motifs associated with PTB-activated exons
a) Volcano plots as in Fig. 4a for PTB-activated compared to control cassette exons. (b) Enriched motifs ranked by P value as in Fig 4b. No significantly enriched motifs were found within the exon sequences. (c) Clustered significant motifs as in Fig. 4c.
Figure 6. PTB acts via a ESS
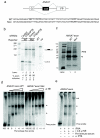
(a) Schematic representation of ANXA7 exon 6 minigene reporter (top). ANXA7 exon 6 sequence (black rectangle) and 200 nucleotides of the flanking introns were cloned into the GFP reporter vector. WT and mutant sequences of the ANXA7 exon are shown at the bottom. UCUU type motifs are shown in bold (b) RT-PCR of ANXA7 minigene wild type (Wt) or mutated version (Mut) cotransfected with siRNAs against PTB and nPTB or control siRNAs. Molecular markers (nt) are shown to the left. (c) UV-crosslinking of ANXA7 exon 6 WT and mutant (Mut) RNAs in HeLa nuclear extracts. Molecular marker sizes (kDa) are shown to the left. The position of the PTB crosslinked doublet is shown to the right. (d) Electrophoretic mobility shift assay of WT and mutant RNAs with HeLa nuclear extracts. Each sample contains 10 fmol of RNA and 0, 0.2, 0.4, 0.8, 1.4 and 2 μl of nuclear extract. Asterisks mark the position of the shifted complexes. Quantification of the extent of the shift is given as percentage of free RNA. (e) Supershift of WT ANXA7 exon 6 RNA with 0.6 μl of HeLa NE and with 2 μl pre-immune serum or PTB antibody as indicated. The position of shifted complexes is marked with an asterisk and a double asterisk shows the supershifted complex.
Figure 7. PTB promotes exon inclusion via an ISE
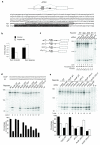
(a) Schematic representation of KTN1 minigene (top). Sequence of KTN1 exon (chr14:55,209,643-55,209,726), 152 nucleotides of upstream and 200 nucleotides of downstream flanking introns were cloned into the GFP reporter (bottom). Intron sequences shown in lower case, exonic sequences in upper case, boxed sequence correspond to identified extended pyrimidine rich sequences Py1 (white box) and Py2 (black box). (b) Changes in inclusion levels of the endogenous KTN1 exon in response to PTB/nPTB knockdown quantified by qPCR in control (black) and PTB/nPTB knockdown (white) conditions. Values shown are mean ± s.d., n=3 (c) The minigene reporter and intronic deletions are shown schematically to the left. ΔPy1 is deletion of the first pyrimidine tract (white box on panel a); ΔPy2 is deletion of the second pyrimidine tract (black box on panel a) or ΔPy1,2 deletion of both sequences. RT-PCR of KTN1 minigene reporter (wt) and deletions cotransfected with control or PTB/nPTB siRNAs. Size markers are shown to the left of the gel and % of exon inclusion is shown at the bottom of the gel. Values shown are mean ± s.d., n=3, except ΔPy1,2 that is n=15. (d) Sequence of pyrimidine rich tract (PyUP) or a non related sequence (nrs) inserted 68 nucleotides upstream of the KTN1 exon (top). RT-PCR of the indicated minigene reporters transfected in HeLa cells (middle). Values shown are mean percentage exon inclusion ± s.d., n=3 (Bottom). (e) RT-PCR of the indicated minigene reporters cotransfected with control or PTB/nPTB siRNAs. The histogram aligned below shows mean percentage exon inclusion ± s.d., n=3.
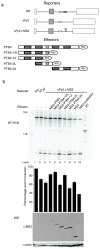
Figure 8. MS2 recruitment to downstream intron reveals PTB minimal activation domain
(a) Schematic representation of minigene reporters and effectors utilized in the experiment. (b) RT-PCR (top), quantification of percentage exon inclusion (middle) and western blot (bottom) of the same transfection experiments probed with anti MS2 and anti actin as loading control. Histogram bars and western blots are aligned with the lanes of the preceding RT-PCR gel. Values shown are mean ± s.d., n=3.
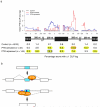
Figure 9. Position dependent PTB mode of action
(a) Density of CLIP-seq tags{Xue, 2009 #235} (top) and percentage of exons and intronic segments overlapped by ≥1 CLIP tag (bottom) on control, PTB-activated and PTB-repressed exons (this study) within 7 regions around regulated exons, including 200nt of intronic regions, the regulated exons as well as 100nt in the flanking constitutive exons. Black line represents control exons, red line PTB- activated exons and purple line PTB-repressed exons. Significant differences between PTB-regulated and control exons were determined by Fisher exact tests and are highlighted in yellow (P < 0.05). The most significant enrichments were observed immediately downstream of activated exons (P = 4.9 × 10⁻⁵), immediately upstream of repressed exons (P = 1.2 × 10⁻¹⁷) and within repressed exons (P = 1.7 × 10⁻⁹). (b) The cartoon represents an alternative cassette exon (blue box) and flanking constitutive exons (white boxes). Intronic sequences are shown as thin lines, exonic/intronic splicing silencers are depicted as green rectangles and splicing enhancers are depicted as red rectangles. PTB (orange oval shape) binding to downstream sequences promotes exon inclusion and binding to upstream intronic or exonic sequences promotes exon skipping.
Similar articles
- Positioning of pyrimidine motifs around cassette exons defines their PTB-dependent splicing in Arabidopsis.
Burgardt R, Lambert D, Heuwieser C, Sack M, Wagner G, Weinberg Z, Wachter A. Burgardt R, et al. Plant J. 2024 Jun;118(6):2202-2218. doi: 10.1111/tpj.16739. Epub 2024 Apr 5. Plant J. 2024. PMID: 38578875 - Polypyrimidine tract binding protein functions as a repressor to regulate alternative splicing of alpha-actinin mutally exclusive exons.
Southby J, Gooding C, Smith CW. Southby J, et al. Mol Cell Biol. 1999 Apr;19(4):2699-711. doi: 10.1128/MCB.19.4.2699. Mol Cell Biol. 1999. PMID: 10082536 Free PMC article. - Regulation of alternative splicing by PTB and associated factors.
Spellman R, Rideau A, Matlin A, Gooding C, Robinson F, McGlincy N, Grellscheid SN, Southby J, Wollerton M, Smith CW. Spellman R, et al. Biochem Soc Trans. 2005 Jun;33(Pt 3):457-60. doi: 10.1042/BST0330457. Biochem Soc Trans. 2005. PMID: 15916540 Review. - New insights into functional roles of the polypyrimidine tract-binding protein.
Romanelli MG, Diani E, Lievens PM. Romanelli MG, et al. Int J Mol Sci. 2013 Nov 20;14(11):22906-32. doi: 10.3390/ijms141122906. Int J Mol Sci. 2013. PMID: 24264039 Free PMC article. Review.
Cited by
- Intrinsic Regulatory Role of RNA Structural Arrangement in Alternative Splicing Control.
Taylor K, Sobczak K. Taylor K, et al. Int J Mol Sci. 2020 Jul 21;21(14):5161. doi: 10.3390/ijms21145161. Int J Mol Sci. 2020. PMID: 32708277 Free PMC article. Review. - Tau Post-Translational Modifications: Potentiators of Selective Vulnerability in Sporadic Alzheimer's Disease.
Carroll T, Guha S, Nehrke K, Johnson GVW. Carroll T, et al. Biology (Basel). 2021 Oct 15;10(10):1047. doi: 10.3390/biology10101047. Biology (Basel). 2021. PMID: 34681146 Free PMC article. Review. - Illuminating the Transcriptome through the Genome.
Elliott DJ. Elliott DJ. Genes (Basel). 2014 Mar 14;5(1):235-53. doi: 10.3390/genes5010235. Genes (Basel). 2014. PMID: 24705295 Free PMC article. - Advances in transcriptome analysis of human brain aging.
Ham S, Lee SV. Ham S, et al. Exp Mol Med. 2020 Nov;52(11):1787-1797. doi: 10.1038/s12276-020-00522-6. Epub 2020 Nov 26. Exp Mol Med. 2020. PMID: 33244150 Free PMC article. Review. - Polypyrimidine tract binding protein homologs from Arabidopsis are key regulators of alternative splicing with implications in fundamental developmental processes.
Rühl C, Stauffer E, Kahles A, Wagner G, Drechsel G, Rätsch G, Wachter A. Rühl C, et al. Plant Cell. 2012 Nov;24(11):4360-75. doi: 10.1105/tpc.112.103622. Epub 2012 Nov 27. Plant Cell. 2012. PMID: 23192226 Free PMC article.
References
- Matlin AJ, Clark F, Smith CW. Understanding alternative splicing: towards a cellular code. Nat Rev Mol Cell Biol. 2005;6:386–98. - PubMed
- Blencowe BJ. Alternative splicing: new insights from global analyses. Cell. 2006;126:37–47. - PubMed
- Barash Y, Calarco JA, Gao W, Pan Q, Wang X, Shai O, Blencowe BJ, Frey BJ. Deciphering the splicing code. Nature. 2010;465:53–9. - PubMed
Publication types
MeSH terms
Substances
LinkOut - more resources
Full Text Sources
Other Literature Sources


