TGF-beta IL-6 axis mediates selective and adaptive mechanisms of resistance to molecular targeted therapy in lung cancer - PubMed (original) (raw)
. 2010 Aug 31;107(35):15535-40.
doi: 10.1073/pnas.1009472107. Epub 2010 Aug 16.
Silvia Fenoglio, Ding Cheng Gao, Matthew Camiolo, Brendon Stiles, Trine Lindsted, Michaela Schlederer, Chris Johns, Nasser Altorki, Vivek Mittal, Lukas Kenner, Raffaella Sordella
Affiliations
- PMID: 20713723
- PMCID: PMC2932568
- DOI: 10.1073/pnas.1009472107
TGF-beta IL-6 axis mediates selective and adaptive mechanisms of resistance to molecular targeted therapy in lung cancer
Zhan Yao et al. Proc Natl Acad Sci U S A. 2010.
Abstract
The epidermal growth-factor receptor (EGFR) tyrosine kinase inhibitor erlotinib has been proven to be highly effective in the treatment of nonsmall cell lung cancer (NSCLC) harboring oncogenic EGFR mutations. The majority of patients, however, will eventually develop resistance and succumb to the disease. Recent studies have identified secondary mutations in the EGFR (EGFR T790M) and amplification of the N-Methyl-N'-nitro-N-nitroso-guanidine (MNNG) HOS transforming gene (MET) oncogene as two principal mechanisms of acquired resistance. Although they can account for approximately 50% of acquired resistance cases together, in the remaining 50%, the mechanism remains unknown. In NSCLC-derived cell lines and early-stage tumors before erlotinib treatment, we have uncovered the existence of a subpopulation of cells that are intrinsically resistant to erlotinib and display features suggestive of epithelial-to-mesenchymal transition (EMT). We showed that activation of TGF-beta-mediated signaling was sufficient to induce these phenotypes. In particular, we determined that an increased TGF-beta-dependent IL-6 secretion unleashed previously addicted lung tumor cells from their EGFR dependency. Because IL-6 and TGF-beta are prominently produced during inflammatory response, we used a mouse model system to determine whether inflammation might impair erlotinib sensitivity. Indeed, induction of inflammation not only stimulated IL-6 secretion but was sufficient to decrease the tumor response to erlotinib. Our data, thus, argue that both tumor cell-autonomous mechanisms and/or activation of the tumor microenvironment could contribute to primary and acquired erlotinib resistance, and as such, treatments based on EGFR inhibition may not be sufficient for the effective treatment of lung-cancer patients harboring mutant EGFR.
Conflict of interest statement
The authors declare no conflict of interest.
Figures
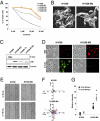
Fig. 1.
Erlotinib-resistant cells are characterized by mesenchymal-like features and an increased metastatic potential. (A) Parental and resistant cell lines were treated with erlotinib at the indicated concentrations. Viability of cells was measured after 72 h of treatment by 3-(4,5-Dimethylthiazol-2-yl)-2,5-diphenyltetrazolium bromide (MTT) assay. The percentage of viable cells was calculated relative to untreated control. (B) As shown by scanning electron microscopy, striking morphological differences were readily observed in certain erlotinib-resistant cells (i.e., 13% of erlotinib-derived resistant cells). (C) Western blot analysis of cell extracts with E-cadherin and Vimentin antibodies and (D) immunofluorescence staining of cells labeled with E-cadherin and Vimentin antibodies. (E) Images from a time-lapse sequence of erlotinib-sensitive (H1650) and erlotinib-resistant cells (H1650-M3) migrating to heal a scratch. The images were taken immediately after scratching the cell monolayer (time = 0 h) and after 16 h. (F) Tracking the movement of single cells (n = 12) revealed differences in intrinsic cell motility. Each trace represents the movement of a single cell, whereas individual dots designate a frame of 10 min. (G) A modified Boyden-chamber assay using filters coated with different volumes of Matrigel (i.e., 20 μL and 40 μL) showed an increased invasive potential of the erlotinib-resistant cells relative to parental cells. Each dot represents an individual replicate (n = 5).
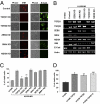
Fig. 2.
The activation of the TGF-β1 and TGF-β2 signaling is required and sufficient for EMT, increased cell motility and invasion, and erlotinib resistance. (A) To determine the contributions of TGF-β signaling pathways in mediating erlotinib resistance and EMT, we used RNA interference-based technology to inhibit the expression of TGF-β1 and TGF-β2 as well as SNAI and ZEB2. A shRNA-targeting nexillin (NEXN) was used as a control. Two independent shRNA constructs were used to generate cell lines in which the expression of each gene of interest was stably knocked down. Although similar results were obtained with both shRNAs, the figure depicts the result obtained with one shRNA only. RT-PCR analysis showed a dramatic decrease in the expression of the targeted genes. (B) Changes in the expression of Vimentin and E-cadherin observed by RT-PCR were confirmed by immunostaining analysis. (C) Erlotinib-resistant cells in which TGF-β1 and TGF-β2 expression was silenced displayed sensitivity to erlotinib comparable with that of the parental cells (H1650). The data shown represent the mean value of the percentage of viable cells ± SD (n = 6; P < 0.0001). (D) Erlotinib-sensitive (H1650 cells) cells treated for 8 d with TGF-β1, TGF-β2, or TGF-β1 and TGF-β2 in combination displayed an increased resistance to erlotinib. Cell viability was measured by MTT assay. The percentage of viable cells was calculated relative to untreated cells. The bars shown are the means ± SD (n = 4), and the differences between the treated and control cells are significant (P < 0.0001, two-tailed Student t test).
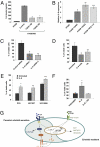
Fig. 3.
IL-6 is responsible for the EGFR-independent STAT3 phosphorylation observed in the erlotinib-resistant cells. (A) TGF-β1 and 2 are required for the expression of IL-6. The chart represents IL-6 levels in the media secreted by H1650, H1650-M3 (control) and TGF-β1, or TGF-β2 knockdown cells determined by an ELISA. The data are the means ± SD (n = 4), and the Student t test showed significant difference (t < 0.05). (B) TGF-β treatment is sufficient to induce the expression of IL-6. The H1650 cells were treated for 2 d with TGF-β1, TGF-β2, or both in combination, and the RNA was isolated and subjected to a quantitative RT-PCR test. The data shown represent the relative expression level (means ± SD; n = 6). (C) Blockage of IL-6 signaling decreased cell viability. Cells were transfected with the indicated siRNA. After 2 d, the cells viability was determined by MTT assay and expressed relative to untreated cells (n = 4). (D) The chart shows the percentage of viable cells relative to control in the presence of 10 μg/mL IL-6 neutralizing antibody and 2 μM pan-Jak inhibitor (P6). (Data shown are the means ± SD; P < 0.02). (E) IL-6 is sufficient to modify sensitivity of cells to erlotinib treatment. Viability of PC9, HCC827, and HCC4006 cells was determined in the presence of 0.01 mM erlotinib. Of note, PC9, HCC827, and HCC4006 cells have different basal-cell sensitivities to erlotinib. Cell viability by IL-6 treatment is shown with the means of the percentage of viable cells ± SD (n = 6; P ≤ 0.0002). (F) Treatment with the JAK1/2 inhibitor P6 restored the cell sensitivity to erlotinib. Cells were pretreated with IL-6 (10 ng/mL) or IL-6 and P6 (2 μM) and then, treated with erlotinib (5 μM). After 72 h, cell viability was assessed. Each bar represents the average of four replicates ± SD (P < 0.01). (G) Schematic representation of our model system. Paracrine or autocrine stimulation of the TGF-β axis is sufficient to lead to acquisition of mesenchymal-like morphology, increased motility and invasion ability, and increased erlotinib resistance. However, in erlotinib-sensitive cells, mutant EGFR regulates the expression of IL-6; in erlotinib-resistant cells, TGF-β drives the expression of IL-6 independently of the activation of EGFR and unleashes the cells from their EGFR activity dependency.
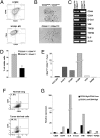
Fig. 4.
Erlotinib-resistant mesenchymal-like cells are present in cell lines and tumors before erlotinib treatment. (A) H1650 cells and H1650-M3 cells were analyzed by flow cytometry for CD44 and CD24 expression. (B) The bright field image of the sorted cells showed that the CD44high/CD24low population of the H1650 cells has distinct morphology and like H1650-M3 cells, resembles mesenchymal cells. (C) RT-PCR analysis of sorted cells indicated that cells in the CD44high/CD24low population of the H1650 cells have increased expression of Vimentin, TGF-β1, TGF- β2, and IL-6 and diminished expression of E-cadherin relative to most H1650 cells. (D) Similar to the erlotinib-resistant H1650-M3 cells, the CD44high/CD24low fraction of H1650 cells is more resistant to erlotinib treatment than the unsorted H1650 cells. Sorted cells were treated with 5 μM of erlotinib for 72 h. Cell viability was assessed by MTT assay and expressed relative to untreated cells (n = 6; P < 0.0001). (E) Flow-cytometry analysis for CD44 and CD24 of cells harboring mutant EGFR (i.e., HCC827, H1975, PC9, and HCC4006 cells) and the H1299 cells that are wild-type for the EGFR gene revealed the presence of subpopulations of cells that are CD44high/CD24low. The chart represents the percentage of CD44high/CD24low cells relative to total number of viable cells. (F) NSCLC harbors CD44high/CD24low subpopulations. Dissociated tumor cells were sorted for CD45, CD31, and EpCAM and analyzed for CD44 and CD24 expression. (G) Real-time PCR analysis was used to compare CD45−CD31−EpCAM+CD44highCD24low cells with CD45−CD31−EpCAM+CD44lowCD24high cells.
Fig. 5.
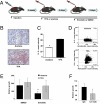
Inflammation induces IL-6 expression, which decreases the tumor sensitivity to erlotinib. (A) Schematic figure of the mouse model used in our studies. Mice were injected with H1650 cells s.c. After ∼3 wk, when the tumor reached a volume of ∼100 mm3, mice were treated topically with TPA or vehicle (acetone) every other day. At day 5, the mice were treated with erlotinib or DMSO by oral gavage for 9 d. At this time, the tumor burden was evaluated. Each time point represents the average of at least six tumors. (B) TPA treatment induces expression of IL-6. Formalin-fixed, paraffin-embedded sections (4 μm) were stained for IL-6 and counterstained with hematoxilin. (C) Protein expression was measured by defining regions of interest (ROI) using automated cell acquisition and quantification software for immunohistochemistry (Histoquest). (D) The IL-6 mean intensities in tumors from a representative animal treated with TPA and a vehicle-treated animal are shown. (E) TPA treatment decreases the tumors response to erlotinib treatment. The chart represents growth percentage of tumors. Each column represents the mean volume of eight different tumors. Of note, similar effects were observed on treatment with LPS (
SI Appendix, Fig. S8
). (F) The effects of TPA are, in part, caused by an increased secretion of IL-6. Before erlotinib treatment, mice were injected intraperitoneally with IL-6 neutralizing antibody (0.08 mg/g) or as a control, with IgG (0.08 mg/g). After 8 d, tumor burden was evaluated, and the averages of four separate tumors were charted.
References
- Lynch TJ, et al. Activating mutations in the epidermal growth factor receptor underlying responsiveness of non-small-cell lung cancer to gefitinib. N Engl J Med. 2004;350:2129–2139. - PubMed
- Maemondo M, et al. Gefitinib or chemotherapy for non-small-cell lung cancer with mutated EGFR. N Engl J Med. 2010;362:2380–2388. - PubMed
- Paez JG, et al. EGFR mutations in lung cancer: Correlation with clinical response to gefitinib therapy. Science. 2004;304:1497–1500. - PubMed
- Wakeling AE, et al. ZD1839 (Iressa): An orally active inhibitor of epidermal growth factor signaling with potential for cancer therapy. Cancer Res. 2002;62:5749–5754. - PubMed
Publication types
MeSH terms
Substances
LinkOut - more resources
Full Text Sources
Other Literature Sources
Medical
Research Materials
Miscellaneous
