MicroRNA-target pairs in human renal epithelial cells treated with transforming growth factor beta 1: a novel role of miR-382 - PubMed (original) (raw)
MicroRNA-target pairs in human renal epithelial cells treated with transforming growth factor beta 1: a novel role of miR-382
Alison J Kriegel et al. Nucleic Acids Res. 2010 Dec.
Abstract
We reported previously an approach for identifying microRNA (miRNA)-target pairs by combining miRNA and proteomic analyses. The approach was applied in the present study to examine human renal epithelial cells treated with transforming growth factor β1 (TGFβ1), a model of epithelial-mesenchymal transition important for the development of renal interstitial fibrosis. Treatment of human renal epithelial cells with TGFβ1 resulted in upregulation of 16 miRNAs and 18 proteins and downregulation of 17 miRNAs and 16 proteins. Of the miRNAs and proteins that exhibited reciprocal changes in expression, 77 pairs met the sequence criteria for miRNA-target interactions. Knockdown of miR-382, which was up-regulated by TGFβ1, attenuated TGFβ1-induced loss of the epithelial marker E-cadherin. miR-382 was confirmed by 3'-untranslated region reporter assay to target five genes that were downregulated at the protein level by TGFβ1, including superoxide dismutase 2 (SOD2). Knockdown of miR-382 attenuated TGFβ1-induced downregulation of SOD2. Overexpression of SOD2 ameliorated TGFβ1-induced loss of the epithelial marker. The study provided experimental evidence in the form of reciprocal expression at the protein level for a large number of predicted miRNA-target pairs and discovered a novel role of miR-382 and SOD2 in the loss of epithelial characteristics induced by TGFβ1.
Figures
Figure 1.
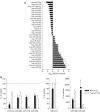
TGFβ1 had widespread effects on miRNA expression in human renal epithelial cells. HK2 cells were treated with vehicle or 3 ng/ml of TGFβ1 for 24 h. (A) 33 of the 376 miRNAs examined with real-time qPCR array were differentially expressed. n = 3. See ‘Materials and Methods’ section for the criteria of differential expression. (B) Verification of the result of miRNA expression profiling. RNA samples used for the individual Taqman qPCR analysis were independent of those used in the high-throughput profiling with the SYBR Green qPCR array. n = 3 for qPCR array, n = 4 for Taqman qPCR; *significantly different from vehicle (P < 0.05 for Taqman qPCR; see ‘Materials and Methods’ section for the criteria of differential expression for qPCR array).
Figure 2.
Verification of proteomic results. HK2 cells were treated as described in Table 1. Protein samples used for the western blot analysis were independent of those used for the proteomic analysis. TPM1, tropomyosin 1; SOD2, superoxide dismutase 2. The gel shown for TPM1 was a time course analysis. Only the 48-h time point was plotted in the bar graph for comparison with the proteomic data. n = 4 for proteomics, n = 3 for western blot; *significantly different from vehicle (P < 0.05 for western blot; see ‘Materials and Methods’ section for the criteria of differential expression for the proteomic analysis).
Figure 3.
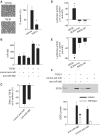
miR-382 targeted SOD2 and contributed to TGFβ1-induced loss of epithelial characteristics in human renal epithelial cells. (A) TGFβ1 induced loss of epithelial characteristics in HK2 cells as indicated by typical changes in cell morphology and a suppression of E-cadherin mRNA, an epithelial marker. TGFβ1 was used at 3 ng/ml for 48 h. N = 6, *P < 0.05. (B) Knockdown of miR-382. HK2 cells were treated with vehicle or TGFβ1 in the presence of LNA anti-miR-382 or LNA scrambled control anti-miR (100 nM). n = 6, *P < 0.05 vs. no treatment; #P < 0.05 versus TGFβ1 plus control anti-miR. (C) Knockdown of miR-382 attenuated the suppression of E-cadherin mRNA by TGFβ1. n = 6–9, *P < 0.05 versus control anti-miR. (D) miR-382 interacted with the 3′-UTR of SOD2 in Hela cells. Hela cells were transfected with luciferase reporter constructs containing a 3′-UTR segment of SOD2 or a mutated (SOD2-mut) or partially deleted (SOD2-del) segment. The mutations and deletion were described in the text. The effect of anti-miR-382 (100 nM) compared to control, scramble anti-miR was shown. n = 4, *P < 0.05 versus control anti-miR. (E) miR-382 interacted with 3′-UTR of SOD2 in HK2 cells. HK2 cells were transfected with luciferase reporter constructs as described above. The effect of pre-miR-382 (100 nM), a miR-382 mimic, compared with control, scramble pre-miR was shown. n = 4, *P < 0.05 versus control pre-miR. (F) SOD2 expression was suppressed by TGFβ1, but partially restored by knockdown of miR-382. miR-382 in TGFβ1-treated HK2 cells was knocked down with LNA anti-miR (see Figure 3B). n = 6, *P < 0.05 vs. control anti-miR.
Figure 4.
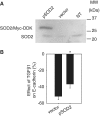
SOD2 was protective against TGFβ1-induced loss of epithelial characteristics. (A) Overexpression of SOD2 with a Myc-DDK-tagged plasmid (pSOD2). HK2 cells were not transfected (NT) or were transfected with pSOD2 or an empty vector (2 µg for each 3.5-cm dish). Western blot was performed 24 h later using an SOD2 antibody. (B) Overexpression of SOD2 attenuated TGFβ1-induced downregulation of E-cadherin. n = 5, *P < 0.05.
Similar articles
- miR-141 regulates TGF-β1-induced epithelial-mesenchymal transition through repression of HIPK2 expression in renal tubular epithelial cells.
Huang Y, Tong J, He F, Yu X, Fan L, Hu J, Tan J, Chen Z. Huang Y, et al. Int J Mol Med. 2015 Feb;35(2):311-8. doi: 10.3892/ijmm.2014.2008. Epub 2014 Nov 24. Int J Mol Med. 2015. PMID: 25421593 Free PMC article. - miRNA589 regulates epithelial-mesenchymal transition in human peritoneal mesothelial cells.
Zhang K, Zhang H, Zhou X, Tang WB, Xiao L, Liu YH, Liu H, Peng YM, Sun L, Liu FY. Zhang K, et al. J Biomed Biotechnol. 2012;2012:673096. doi: 10.1155/2012/673096. Epub 2012 Oct 3. J Biomed Biotechnol. 2012. PMID: 23118514 Free PMC article. - MiRNA-200b represses transforming growth factor-β1-induced EMT and fibronectin expression in kidney proximal tubular cells.
Tang O, Chen XM, Shen S, Hahn M, Pollock CA. Tang O, et al. Am J Physiol Renal Physiol. 2013 May 15;304(10):F1266-73. doi: 10.1152/ajprenal.00302.2012. Epub 2013 Feb 13. Am J Physiol Renal Physiol. 2013. PMID: 23408168 - The differential role of Smad2 and Smad3 in the regulation of pro-fibrotic TGFbeta1 responses in human proximal-tubule epithelial cells.
Phanish MK, Wahab NA, Colville-Nash P, Hendry BM, Dockrell ME. Phanish MK, et al. Biochem J. 2006 Jan 15;393(Pt 2):601-7. doi: 10.1042/BJ20051106. Biochem J. 2006. PMID: 16253118 Free PMC article. - MiR-448-5p inhibits TGF-β1-induced epithelial-mesenchymal transition and pulmonary fibrosis by targeting Six1 in asthma.
Yang ZC, Qu ZH, Yi MJ, Shan YC, Ran N, Xu L, Liu XJ. Yang ZC, et al. J Cell Physiol. 2019 Jun;234(6):8804-8814. doi: 10.1002/jcp.27540. Epub 2018 Oct 26. J Cell Physiol. 2019. PMID: 30362537
Cited by
- MicroRNA-382-5p aggravates breast cancer progression by regulating the RERG/Ras/ERK signaling axis.
Ho JY, Hsu RJ, Liu JM, Chen SC, Liao GS, Gao HW, Yu CP. Ho JY, et al. Oncotarget. 2017 Apr 4;8(14):22443-22459. doi: 10.18632/oncotarget.12338. Oncotarget. 2017. PMID: 27705918 Free PMC article. - APP-CD74 axis mediates endothelial cell-macrophage communication to promote kidney injury and fibrosis.
Liu B, Li F, Wang Y, Gao X, Li Y, Wang Y, Zhou H. Liu B, et al. Front Pharmacol. 2024 Sep 16;15:1437113. doi: 10.3389/fphar.2024.1437113. eCollection 2024. Front Pharmacol. 2024. PMID: 39351084 Free PMC article. - MicroRNA-214-3p in the Kidney Contributes to the Development of Hypertension.
Liu Y, Usa K, Wang F, Liu P, Geurts AM, Li J, Williams AM, Regner KR, Kong Y, Liu H, Nie J, Liang M. Liu Y, et al. J Am Soc Nephrol. 2018 Oct;29(10):2518-2528. doi: 10.1681/ASN.2018020117. Epub 2018 Jul 26. J Am Soc Nephrol. 2018. PMID: 30049682 Free PMC article. - Signature MicroRNA expression profile is associated with lipid metabolism in African green monkey.
Zhou XJ, Wang J, Ye HH, Fa YZ. Zhou XJ, et al. Lipids Health Dis. 2019 Feb 28;18(1):55. doi: 10.1186/s12944-019-0999-2. Lipids Health Dis. 2019. PMID: 30819205 Free PMC article. - Base-resolution maps of 5-methylcytosine and 5-hydroxymethylcytosine in Dahl S rats: effect of salt and genomic sequence.
Liu Y, Liu P, Yang C, Cowley AW Jr, Liang M. Liu Y, et al. Hypertension. 2014 Apr;63(4):827-38. doi: 10.1161/HYPERTENSIONAHA.113.02637. Epub 2014 Jan 13. Hypertension. 2014. PMID: 24420542 Free PMC article.
References
- Ambros V. The functions of animal microRNAs. Nature. 2004;431:350–355. - PubMed
- Bartel DP. MicroRNAs: genomics, biogenesis, mechanism, and function. Cell. 2004;116:281–297. - PubMed
- He L, Hannon GJ. MicroRNAs: small RNAs with a big role in gene regulation. Nat. Rev. Genet. 2004;5:522–531. - PubMed
- Kim VN. MicroRNA biogenesis: coordinated cropping and dicing. Nat. Rev. Mol. Cell Biol. 2005;6:376–385. - PubMed
- Hobert O. Gene regulation by transcription factors and microRNAs. Science. 2008;319:1785–1786. - PubMed
Publication types
MeSH terms
Substances
Grants and funding
- HL081091/HL/NHLBI NIH HHS/United States
- HL082798/HL/NHLBI NIH HHS/United States
- HL085267/HL/NHLBI NIH HHS/United States
- HL029587/HL/NHLBI NIH HHS/United States
- DK084405/DK/NIDDK NIH HHS/United States
- N01-HV-28182/HV/NHLBI NIH HHS/United States
- HL077263/HL/NHLBI NIH HHS/United States
LinkOut - more resources
Full Text Sources
Other Literature Sources
Miscellaneous


