A comprehensive survey of 3' animal miRNA modification events and a possible role for 3' adenylation in modulating miRNA targeting effectiveness - PubMed (original) (raw)
A comprehensive survey of 3' animal miRNA modification events and a possible role for 3' adenylation in modulating miRNA targeting effectiveness
A Maxwell Burroughs et al. Genome Res. 2010 Oct.
Abstract
Animal microRNA sequences are subject to 3' nucleotide addition. Through detailed analysis of deep-sequenced short RNA data sets, we show adenylation and uridylation of miRNA is globally present and conserved across Drosophila and vertebrates. To better understand 3' adenylation function, we deep-sequenced RNA after knockdown of nucleotidyltransferase enzymes. The PAPD4 nucleotidyltransferase adenylates a wide range of miRNA loci, but adenylation does not appear to affect miRNA stability on a genome-wide scale. Adenine addition appears to reduce effectiveness of miRNA targeting of mRNA transcripts while deep-sequencing of RNA bound to immunoprecipitated Argonaute (AGO) subfamily proteins EIF2C1-EIF2C3 revealed substantial reduction of adenine addition in miRNA associated with EIF2C2 and EIF2C3. Our findings show 3' addition events are widespread and conserved across animals, PAPD4 is a primary miRNA adenylating enzyme, and suggest a role for 3' adenine addition in modulating miRNA effectiveness, possibly through interfering with incorporation into the RNA-induced silencing complex (RISC), a regulatory role that would complement the role of miRNA uridylation in blocking DICER1 uptake.
Figures
Figure 1.
3′ miRNA addition across organisms. (A) Proportion of miRNA loci found to have single nucleotide unambiguous addition significantly greater than expected error rate (see Methods) across seven deep-sequenced short RNA libraries in four species. Sets of miRNA loci with adenine addition (B) and uridine addition (C) found to have significant amounts of addition in multiple vertebrate species. miRNA loci shaded in gray have significant addition in three of the four human cell lines; loci shaded in black have significant addition in all four human cell lines. Comparison of the proportion of unambiguous adenine (D) and uridine (E) addition for individual miRNA loci in the four human cell lines; Spearman's correlation and _P_-values are given in the corners of individual scatterplots.
Figure 2.
PAPD4 broadly affects adenine addition at THP-1 miRNA loci. Comparison of unambiguous adenine addition rates (A) and ambiguous adenine addition rates (B) across control and PAPD4, PAPD5, and PAPD7 knockdown short RNA libraries. Lower left panels plot the percentage of adenine addition at specific loci between libraries, which are labeled on the diagonal panels. Loci with <50 sequence tags in the control condition are excluded to reduce noise. Upper right panels give the Pearson's correlation between two libraries. Loci with significant decrease (Fisher's exact test, Bonferroni post hoc correction) in addition relative to control library are colored in orange. (C) Percentage of reduction in adenine addition at miRNA loci in the PAPD4 knockdown library relative to control library for miRNA loci which meet the following two requirements: (1) reduction relative to control library is significant, and (2) addition is significantly greater than the expected error rate of addition (see Methods).
Figure 3.
miRNA expression levels are unaffected by PAPD4 knockdown and 3′ miRNA adenine addition reduces mRNA target repression. (A) Total sequence tag counts mapping to all miRNA loci compared across the control and PAPD4 knockdown short RNA libraries. Tag counts are normalized into tags per million (tpm) and log2-transformed. Pearson's correlation is given in the upper left corner of the plot. (B–D) Targets of miRNA (B, ZBTB10; C, CHORDC1; D, SMAD1) are repressed after transfection of primary miRNA sequence (left) and repression is reduced after transfection of miRNA with 3′ adenine addition (right). Expression ratio is normalized to the endogenous GAPDH mRNA level, with average values bracketed by SEM error bars (Methods). While ZBT10 expression appears to be reduced, the change is not significant at a threshold P < 0.05. $P = 0.065 for miR-27a targeting of ZBTB10, *P = 0.030 for miR-26a targeting of CHORDC1, and **P = 0.028 for miR-26a targeting of SMAD1 (paired Students _t_-test, n = 3). (E) Expression levels of mRNA targets of different miRNA are generally decreased after knockdown of PAPD4. Each bar represents a distinct mRNA target, labeled on the _x_-axis along with the known miRNA that targets that gene. Expression ratio is normalized as in B–D, with n = 4. The expression level of PAPD4 during knockdown is provided as a reference in the far right bar of the plot. (F) Luciferase activity of reporter assay for wild-type and mutated miRNA target sequence of CNDP2 mRNA transcript. Luciferase activity is measured as described in Methods and tested in normal and PAPD4 knockdown conditions. ***P = 0.035 in normal condition and ****P = 0.015 in PAPD4 knockdown condition (paired Students _t_-test, n = 4).
Figure 4.
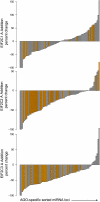
Unambiguous adenine addition is reduced in miRNA bound to EIF2C2 and EIF2C3 proteins. Seventy-six miRNA loci contained significant amounts of 3′ unambiguous adenine addition in the control library. The percentage change of addition in these loci across the EIF2C1, EIF2C2, and EIF2C3 libraries are depicted as barplots with each bar representing one of the 76 loci. Loci are sorted by order of increasing percentage change; therefore, a bar in one plot does not necessarily represent the same miRNA locus as the corresponding bar in another plot. For the list of miRNA loci with names and percentage reductions, please see Supplemental Tables S12, S13. Bars corresponding to loci with significant reduction or increase in the AGO libraries are colored orange.
Figure 5.
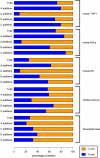
Unambiguous uridine addition occurs predominantly in miRNAs derived from 3′ arm of precursor miRNA. Percentages of unambiguous additions for each single nucleotide are colored according to which arm of the precursor miRNA the addition event originates from. Uridine addition bias is observed across all analyzed vertebrate libraries, species and tissue are labeled on the right.
Figure 6.
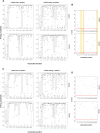
Pairing probability profiles for miRNA with and without 3′ addition events. (A) Boxplots depict the pairing probabilities, and by extension the double-stranded character, of individual nucleotide positions in miRNA at positions 1–19. Boxplots to the left depict the double-stranded character of the set of miRNA with significant unambiguous A addition conserved across human THP-1, human HeLa, and mouse embryonic stem cells. Boxplots to the right depict double-stranded character of the set of miRNA that never show significant addition across the same cell types. Plots to the top are constructed with the sequences of human miRNA; plots to the bottom are constructed with the sequences of mouse miRNA. (B) _P_-values of Wilcoxon rank sum test comparing pairing probabilities at nucleotide positions 1–19 across miRNA with addition and without addition are plotted. Red line plotted at P = 0.05, the level of significance. Positions with conserved significance across human and mouse miRNA are highlighted in yellow. (C,D) Same as A, B, but testing the set of miRNAs with conserved unambiguous uridine addition.
Figure 7.
Proposed general mechanism depicting consequences of 3′ addition. Precursor miRNA is depicted with miRNA strands of the processed duplex colored in purple and orange and the hairpin region colored in gray. Formation of uridine tail in precursor miRNA blocks uptake into DICER1, while PAPD4-mediated adenylation of purple strand, predicted to be mediated at least in part by secondary structure character, selectively interferes with uptake into AGO proteins (interactions which are not thought to proceed are depicted with filled circles).
Similar articles
- Deep-sequencing of human Argonaute-associated small RNAs provides insight into miRNA sorting and reveals Argonaute association with RNA fragments of diverse origin.
Burroughs AM, Ando Y, de Hoon MJ, Tomaru Y, Suzuki H, Hayashizaki Y, Daub CO. Burroughs AM, et al. RNA Biol. 2011 Jan-Feb;8(1):158-77. doi: 10.4161/rna.8.1.14300. Epub 2011 Jan 1. RNA Biol. 2011. PMID: 21282978 Free PMC article. - Mechanisms that impact microRNA stability in plants.
Zhao Y, Mo B, Chen X. Zhao Y, et al. RNA Biol. 2012 Oct;9(10):1218-23. doi: 10.4161/rna.22034. Epub 2012 Sep 20. RNA Biol. 2012. PMID: 22995833 Free PMC article. - The RNA-binding protein QKI-7 recruits the poly(A) polymerase GLD-2 for 3' adenylation and selective stabilization of microRNA-122.
Hojo H, Yashiro Y, Noda Y, Ogami K, Yamagishi R, Okada S, Hoshino SI, Suzuki T. Hojo H, et al. J Biol Chem. 2020 Jan 10;295(2):390-402. doi: 10.1074/jbc.RA119.011617. Epub 2019 Dec 1. J Biol Chem. 2020. PMID: 31792053 Free PMC article. - miRNA Targeting: Growing beyond the Seed.
Chipman LB, Pasquinelli AE. Chipman LB, et al. Trends Genet. 2019 Mar;35(3):215-222. doi: 10.1016/j.tig.2018.12.005. Epub 2019 Jan 9. Trends Genet. 2019. PMID: 30638669 Free PMC article. Review. - RNA decay via 3' uridylation.
Scott DD, Norbury CJ. Scott DD, et al. Biochim Biophys Acta. 2013 Jun-Jul;1829(6-7):654-65. doi: 10.1016/j.bbagrm.2013.01.009. Epub 2013 Feb 4. Biochim Biophys Acta. 2013. PMID: 23385389 Review.
Cited by
- Modulation of microRNA editing, expression and processing by ADAR2 deaminase in glioblastoma.
Tomaselli S, Galeano F, Alon S, Raho S, Galardi S, Polito VA, Presutti C, Vincenti S, Eisenberg E, Locatelli F, Gallo A. Tomaselli S, et al. Genome Biol. 2015 Jan 13;16(1):5. doi: 10.1186/s13059-014-0575-z. Genome Biol. 2015. PMID: 25582055 Free PMC article. - Gld2-catalyzed 3' monoadenylation of miRNAs in the hippocampus has no detectable effect on their stability or on animal behavior.
Mansur F, Ivshina M, Gu W, Schaevitz L, Stackpole E, Gujja S, Edwards YJ, Richter JD. Mansur F, et al. RNA. 2016 Oct;22(10):1492-9. doi: 10.1261/rna.056937.116. Epub 2016 Aug 5. RNA. 2016. PMID: 27495319 Free PMC article. - Testing hypotheses on the rate of molecular evolution in relation to gene expression using microRNAs.
Shen Y, Lv Y, Huang L, Liu W, Wen M, Tang T, Zhang R, Hungate E, Shi S, Wu CI. Shen Y, et al. Proc Natl Acad Sci U S A. 2011 Sep 20;108(38):15942-7. doi: 10.1073/pnas.1110098108. Epub 2011 Sep 12. Proc Natl Acad Sci U S A. 2011. PMID: 21911382 Free PMC article. - R2D2 organizes small regulatory RNA pathways in Drosophila.
Okamura K, Robine N, Liu Y, Liu Q, Lai EC. Okamura K, et al. Mol Cell Biol. 2011 Feb;31(4):884-96. doi: 10.1128/MCB.01141-10. Epub 2010 Dec 6. Mol Cell Biol. 2011. PMID: 21135122 Free PMC article. - Comprehensive assessment of multiple biases in small RNA sequencing reveals significant differences in the performance of widely used methods.
Wright C, Rajpurohit A, Burke EE, Williams C, Collado-Torres L, Kimos M, Brandon NJ, Cross AJ, Jaffe AE, Weinberger DR, Shin JH. Wright C, et al. BMC Genomics. 2019 Jun 21;20(1):513. doi: 10.1186/s12864-019-5870-3. BMC Genomics. 2019. PMID: 31226924 Free PMC article.
References
- Barnard DC, Ryan K, Manley JL, Richter JD 2004. Symplekin and xGLD-2 are required for CPEB-mediated cytoplasmic polyadenylation. Cell 119: 641–651 - PubMed
Publication types
MeSH terms
Substances
LinkOut - more resources
Full Text Sources
Other Literature Sources


