Calmodulin suppresses synaptotagmin-2 transcription in cortical neurons - PubMed (original) (raw)
Calmodulin suppresses synaptotagmin-2 transcription in cortical neurons
Zhiping P Pang et al. J Biol Chem. 2010.
Abstract
Calmodulin (CaM) is a ubiquitous Ca(2+) sensor protein that plays a pivotal role in regulating innumerable neuronal functions, including synaptic transmission. In cortical neurons, most neurotransmitter release is triggered by Ca(2+) binding to synaptotagmin-1; however, a second delayed phase of release, referred to as asynchronous release, is triggered by Ca(2+) binding to an unidentified secondary Ca(2+) sensor. To test whether CaM could be the enigmatic Ca(2+) sensor for asynchronous release, we now use in cultured neurons short hairpin RNAs that suppress expression of ∼70% of all neuronal CaM isoforms. Surprisingly, we found that in synaptotagmin-1 knock-out neurons, the CaM knockdown caused a paradoxical rescue of synchronous release, instead of a block of asynchronous release. Gene and protein expression studies revealed that both in wild-type and in synaptotagmin-1 knock-out neurons, the CaM knockdown altered expression of >200 genes, including that encoding synaptotagmin-2. Synaptotagmin-2 expression was increased several-fold by the CaM knockdown, which accounted for the paradoxical rescue of synchronous release in synaptotagmin-1 knock-out neurons by the CaM knockdown. Interestingly, the CaM knockdown primarily activated genes that are preferentially expressed in caudal brain regions, whereas it repressed genes in rostral brain regions. Consistent with this correlation, quantifications of protein levels in adult mice uncovered an inverse relationship of CaM and synaptotagmin-2 levels in mouse forebrain, brain stem, and spinal cord. Finally, we employed molecular replacement experiments using a knockdown rescue approach to show that Ca(2+) binding to the C-lobe but not the N-lobe of CaM is required for suppression of synaptotagmin-2 expression in cortical neurons. Our data describe a previously unknown, Ca(2+)/CaM-dependent regulatory pathway that controls the expression of synaptic proteins in the rostral-caudal neuraxis.
Figures
FIGURE 1.
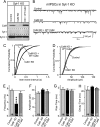
CaM knockdown reduces mini release in Syt1 KO neurons. Cultured cortical neurons from Syt1 KO mice were infected with control lentivirus or with CaM KD lentivirus expressing CaM shRNAs without or with wild-type CaM rescue mRNA (+WT CaM) (24). Neurons were cultured from newborn mice, infected at DIV 5, and analyzed at DIV 14–15. A, representative immunoblots of neurons probed with antibodies to CaM, Syt1, and syntaxin-1 (Synt-1) and visualized by enhanced chemiluminescence. B, representative traces of mIPSCs. C, cumulative distributions of the inter-event intervals of mIPSCs. The plot shows the averages of minis from five neurons. p < 0.001 for control versus CaM KD; the values for control versus CaM KD with rescue were not significant. A Kolmogorov-Smirnov test was used. D, cumulative distributions of the mIPSC amplitudes. The plot shows averages of minis from five neurons. The values for control versus CaM and control versus CaM KD with rescue were not significant. A Kolmogorov-Smirnov test was used. E, summary graphs of the mIPSC frequency. F, summary graphs of the mIPSC amplitude. G, summary graphs of the 10–90% rise time of mIPSCs. H, summary graphs of the 90% to 10% decay time of mIPSCs. The data shown are the means ± S.E.; n = number of cells indicated in the bars from three independent cultures. ***, p < 0.001 as assessed with Student's t test.
FIGURE 2.
CaM KD restores synchronous release in Syt1 KO neurons. Cultured cortical neurons from Syt1 KO and littermate wild-type mice were infected with control lentivirus or with CaM KD lentivirus expressing CaM shRNAs without or with wild-type CaM rescue mRNA (24). Neurons were cultured from newborn mice, infected at DIV 5, and analyzed at DIV 14–15. A, representative traces of evoked IPSCs in Syt1 KO neurons. B, summary graphs of the peak amplitudes of evoked IPSCs (means ± S.E.; numbers of neurons analyzed are shown in bars; n > 3 independent cultures; ***, p < 0.001 per Student's t test). C, time course of the synaptic IPSC charge transfer induced by isolated action potentials. The curves are the averages of n = 11 neurons in each group. D, representative traces of IPSCs evoked by 10 stimuli at 10 Hz in control or CaM KD Syt1 KO neurons and in wild-type neurons. E, normalized synchronous IPSC amplitudes during the 10 Hz stimulus train in CaM KD Syt1 KO (n = 22) and wild-type (n = 10) neurons. The data are the means ± S.E.; the numbers in the bars indicate the number of cells analyzed in at least three independent experiments; statistical significance was calculated by Student's t test (p < 0.01). Numerical data are listed in
supplemental Table S2
.
FIGURE 3.
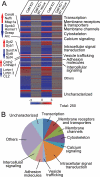
Profiling of gene expression in control, CaM KD, or CaM KD with WT CaM rescue. Cultured cortical neurons from newborn wild-type mice were infected at DIV 5 with control lentivirus or with CaM KD lentivirus expressing CaM shRNAs without or with wild-type CaM rescue mRNA and analyzed using Affimetrix arrays at DIV 14–15. A, heat map plot of gene expression changes in CaM KD neurons without or with wild-type CaM rescue, as compared with control neurons. Only genes with CaM KD-induced changes that were rescued by wild-type CaM are shown (n = 2 independent experiments). B, functional classification of genes changed by the CaM KD and rescued by wild-type CaM.
FIGURE 4.
Validation of gene expression in CaM KD by quantitative real time PCR and immunoblotting. Cultured cortical neurons from newborn wild-type mice were infected at DIV 5 with control lentivirus or with CaM KD lentivirus expressing CaM shRNAs without or with wild-type CaM rescue mRNA and analyzed at DIV 14. A, quantitative real time PCR measurements of the mRNA levels of Syt2, Lrrtm3, Syt9, and CaM3. Note that the CaM3 mRNA levels are not rescued by expression of the rescue CaM2 cDNA. B, immunoblotting analysis of Syt1, Syt2, CaM, and VCP (used as load control).
FIGURE 5.
Quantitation of CaM KD-induced changes in protein levels. Cultured cortical neurons from newborn wild-type mice were infected at DIV 5 with control lentivirus or with CaM KD lentivirus expressing CaM shRNAs without a CaM mRNA or with either wild-type CaM rescue mRNA (+ WT CaM) or a mutant CaM rescue mRNA (+ CaM1,2,3,4) and analyzed at DIV 14. A, representative immunoblots of neuronal proteins using primary antibody against the different proteins as indicated and 125I-conjugated secondary antibodies followed by PhosphoImager detection. B, summary graphs of protein levels measured by quantitative immunoblotting. The data shown are the means ± S.E. *, p < 0.05; **, p < 0.01 as analyzed by Student's t test (n = 3 independent cultures). Synt, syntaxin-1; S-25, SNAP-25; CSP, cysteine string protein; NL1, neuroligin-1; M18, Munc18-1; Rph, rabphilin; SC., secretory carrier membrane protein; GDI, GDP dissociation inhibitor; NL2, neuroligin-2.
FIGURE 6.
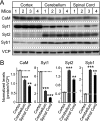
Quantitative analysis of CaM, Syt1, Syt2, and Syb1 levels in cortex, cerebellum, and spinal cord of mice. A, representative immunoblots of mouse cortex, cerebellum/brain stem, and spinal cord homogenates using primary antibody against Syt1, Syt2, Syb1, and CaM and 125I-conjugated secondary antibodies. B, quantitation of Syt1, Syt2, Syb1, and CaM expression levels normalized to VCP in different brain regions. VCP was used as internal loading control because it is ubiquitously expressed without notable differences between cell types. The data shown are the means ± S.E. **, p < 0.01; ***, p < 0.001 as analyzed by Student's t test (n = 4 mice).
FIGURE 7.
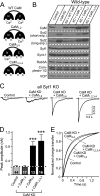
Ca2+ binding to the C-lobe of CaM regulates Syt2 expression in cortical neurons. Cultured cortical neurons from newborn wild-type or Syt1 KO mice were infected at DIV 5 with control lentivirus, with CaM KD lentivirus expressing CaM shRNAs without a CaM rescue construct, or with either wild-type CaM (+ WT CaM) or mutant CaM in which Ca2+ binding to the N-lobe (CaM1,2), the C-lobe (CaM3,4), or both lobes of CaM (CaM1,2,3,4) is blocked. The neurons were analyzed at DIV 14–15. A, schematic structures of wild-type and mutant CaMs. B, immunoblot analysis of the indicated proteins in control and CaM KD neurons expressing various CaM constructs. Note that to better indicate the expression level of Syt2, we did two different exposure times for the immunoblots. The short exposure (short exp.) was ∼15 s, and the long exposure (long exp.) was ∼5 min. C, representative traces of IPSCs monitored in Syt1 KO neurons that were infected with the indicated lentiviruses. D, summary graphs of the peak amplitudes of evoked IPSCs. The data shown are the means ± S.E. ***, p < 0.001 as analyzed by Student's t test (n = number of neurons indicated in bars from three independent cultures. E, kinetic analysis of the IPSC time course (n = 10–17 in each group).
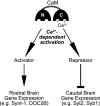
FIGURE 8.
Model for the Ca2+/CaM-dependent regulation of gene expression. The model suggests that Ca2+ binding to the C-lobe of CaM activates a suppressor of the expression of Syt2, Syb1, and Lrrtms and of an enhancer of the expression of Syt9, syntaxin-1A, and contactin-1/contactin-associated protein 1.
Similar articles
- Synaptotagmin-7 Is Essential for Ca2+-Triggered Delayed Asynchronous Release But Not for Ca2+-Dependent Vesicle Priming in Retinal Ribbon Synapses.
Luo F, Bacaj T, Südhof TC. Luo F, et al. J Neurosci. 2015 Aug 5;35(31):11024-33. doi: 10.1523/JNEUROSCI.0759-15.2015. J Neurosci. 2015. PMID: 26245964 Free PMC article. - Doc2 Proteins Are Not Required for the Increased Spontaneous Release Rate in Synaptotagmin-1-Deficient Neurons.
Díez-Arazola R, Meijer M, Bourgeois-Jaarsma Q, Cornelisse LN, Verhage M, Groffen AJ. Díez-Arazola R, et al. J Neurosci. 2020 Mar 25;40(13):2606-2617. doi: 10.1523/JNEUROSCI.0309-19.2020. Epub 2020 Feb 25. J Neurosci. 2020. PMID: 32098902 Free PMC article. - Synaptotagmin-1 and synaptotagmin-7 trigger synchronous and asynchronous phases of neurotransmitter release.
Bacaj T, Wu D, Yang X, Morishita W, Zhou P, Xu W, Malenka RC, Südhof TC. Bacaj T, et al. Neuron. 2013 Nov 20;80(4):947-59. doi: 10.1016/j.neuron.2013.10.026. Neuron. 2013. PMID: 24267651 Free PMC article. - Synaptotagmin: is 2 better than 1?
Leitzell K. Leitzell K. J Neurosci. 2007 Apr 18;27(16):4231-2. doi: 10.1523/JNEUROSCI.0668-07.2007. J Neurosci. 2007. PMID: 17442806 Free PMC article. Review. No abstract available. - The Role of Calmodulin vs. Synaptotagmin in Exocytosis.
Xue R, Meng H, Yin J, Xia J, Hu Z, Liu H. Xue R, et al. Front Mol Neurosci. 2021 Aug 5;14:691363. doi: 10.3389/fnmol.2021.691363. eCollection 2021. Front Mol Neurosci. 2021. PMID: 34421537 Free PMC article. Review.
Cited by
- Lipid-anchored SNAREs lacking transmembrane regions fully support membrane fusion during neurotransmitter release.
Zhou P, Bacaj T, Yang X, Pang ZP, Südhof TC. Zhou P, et al. Neuron. 2013 Oct 16;80(2):470-83. doi: 10.1016/j.neuron.2013.09.010. Epub 2013 Oct 10. Neuron. 2013. PMID: 24120845 Free PMC article. - Translating neuronal activity at the synapse: presynaptic calcium sensors in short-term plasticity.
de Jong AP, Fioravante D. de Jong AP, et al. Front Cell Neurosci. 2014 Oct 29;8:356. doi: 10.3389/fncel.2014.00356. eCollection 2014. Front Cell Neurosci. 2014. PMID: 25400547 Free PMC article. Review. - C-terminal complexin sequence is selectively required for clamping and priming but not for Ca2+ triggering of synaptic exocytosis.
Kaeser-Woo YJ, Yang X, Südhof TC. Kaeser-Woo YJ, et al. J Neurosci. 2012 Feb 22;32(8):2877-85. doi: 10.1523/JNEUROSCI.3360-11.2012. J Neurosci. 2012. PMID: 22357870 Free PMC article. - Human Neuropsychiatric Disease Modeling using Conditional Deletion Reveals Synaptic Transmission Defects Caused by Heterozygous Mutations in NRXN1.
Pak C, Danko T, Zhang Y, Aoto J, Anderson G, Maxeiner S, Yi F, Wernig M, Südhof TC. Pak C, et al. Cell Stem Cell. 2015 Sep 3;17(3):316-28. doi: 10.1016/j.stem.2015.07.017. Epub 2015 Aug 13. Cell Stem Cell. 2015. PMID: 26279266 Free PMC article. - hsa-let-7c miRNA Regulates Synaptic and Neuronal Function in Human Neurons.
McGowan H, Mirabella VR, Hamod A, Karakhanyan A, Mlynaryk N, Moore JC, Tischfield JA, Hart RP, Pang ZP. McGowan H, et al. Front Synaptic Neurosci. 2018 Jul 17;10:19. doi: 10.3389/fnsyn.2018.00019. eCollection 2018. Front Synaptic Neurosci. 2018. PMID: 30065644 Free PMC article.
References
- Bollmann J. H., Sakmann B., Borst J. G. (2000) Science 289, 953–957 - PubMed
- Schneggenburger R., Neher E. (2000) Nature 406, 889–893 - PubMed
- Fernández-Chacón R., Königstorfer A., Gerber S. H., García J., Matos M. F., Stevens C. F., Brose N., Rizo J., Rosenmund C., Südhof T. C. (2001) Nature 410, 41–49 - PubMed
- Geppert M., Goda Y., Hammer R. E., Li C., Rosahl T. W., Stevens C. F., Südhof T. C. (1994) Cell 79, 717–727 - PubMed
Publication types
MeSH terms
Substances
LinkOut - more resources
Full Text Sources
Molecular Biology Databases
Miscellaneous
