A major Y-chromosome haplogroup R1b Holocene era founder effect in Central and Western Europe - PubMed (original) (raw)
doi: 10.1038/ejhg.2010.146. Epub 2010 Aug 25.
Siiri Rootsi, Alice A Lin, Mari Järve, Roy J King, Ildus Kutuev, Vicente M Cabrera, Elza K Khusnutdinova, Andrey Pshenichnov, Bayazit Yunusbayev, Oleg Balanovsky, Elena Balanovska, Pavao Rudan, Marian Baldovic, Rene J Herrera, Jacques Chiaroni, Julie Di Cristofaro, Richard Villems, Toomas Kivisild, Peter A Underhill
Affiliations
- PMID: 20736979
- PMCID: PMC3039512
- DOI: 10.1038/ejhg.2010.146
A major Y-chromosome haplogroup R1b Holocene era founder effect in Central and Western Europe
Natalie M Myres et al. Eur J Hum Genet. 2011 Jan.
Abstract
The phylogenetic relationships of numerous branches within the core Y-chromosome haplogroup R-M207 support a West Asian origin of haplogroup R1b, its initial differentiation there followed by a rapid spread of one of its sub-clades carrying the M269 mutation to Europe. Here, we present phylogeographically resolved data for 2043 M269-derived Y-chromosomes from 118 West Asian and European populations assessed for the M412 SNP that largely separates the majority of Central and West European R1b lineages from those observed in Eastern Europe, the Circum-Uralic region, the Near East, the Caucasus and Pakistan. Within the M412 dichotomy, the major S116 sub-clade shows a frequency peak in the upper Danube basin and Paris area with declining frequency toward Italy, Iberia, Southern France and British Isles. Although this frequency pattern closely approximates the spread of the Linearbandkeramik (LBK), Neolithic culture, an advent leading to a number of pre-historic cultural developments during the past ≤10 thousand years, more complex pre-Neolithic scenarios remain possible for the L23(xM412) components in Southeast Europe and elsewhere.
Figures
Figure 1
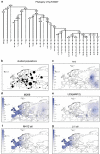
(a) Phylogenetic relationships of haplogroup R binary polymorphisms studied. The names of six polymorphisms whose phylogenetic positions were determined in representative-derived samples, but not surveyed in the entire sample collection are indicated in italics. Dashed lines indicate basal haplogroup branches that were not observed. The YCC nomenclature labels reflect the exclusion of the P25 SNP from the phylogeny given its innate instability. The asterisk (*) refers to the unresolved status of the phylogenetic haplogroups beyond the specified marker. (b) Approximate locations of the 118 studied populations appear as circles on the map that are proportional to sample sizes, the smallest _n_=9 and the largest _n_=522. (c–o). Spatial-frequency distributions of haplogroup-frequency data. Each map was obtained by applying the frequencies from Supplementary Table S4 for 10355 individuals distributed in 118 population samples that are either new or updated to the present phylogenetic-resolution level from literature (references listed in the Supplementary Table 4) plus R-M269 data from Cruciani et al for North African points. Data concerning the strong U152 founder effect signal with identical haplotypes in Northern Bashkirs is excluded from the plots. The frequency data were converted to spatial-frequency maps using Surfer software (version 7, Golden software Inc., Cold Spring Harbor, NY, USA), following the Kriging procedure.
Figure 2
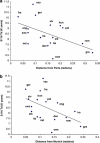
Regression plots of coalescent times for S116 lineages vs distance from (a) Paris and (b) Munich. Population codes: France (fra); Germany (ger); England (eng); Switzerland (swz); Netherlands (net), Ireland (ire); Denmark (den); Italy (ita); Slovakia (slk); Sweden (swe); Greece (gre); Romania (rom); Poland (pol); Hungary (hun); Slovenia (slo).
Figure 3
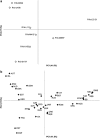
Principal component analysis by haplogroup R1b sub-clades: (a) M269*, L23, M412*, L11*, U106, S116*, U152 and M529 sub-haplogroups with respect to total M269, and (b) by collapsing the 118 populations into 34 regionally defined populations. We excluded populations when the total R1b frequency was <5% or the count was less than _n_=5. Population codes: Austria (AUT); Belarus (BLR); Crete (CRE); Croatia (CRO); Czech Republic (CZE); Denmark (DNK); England (ENG); Estonia (EST); France (FRA); Germany (GER); Greece (GRC); Hungary (HUN); Ireland (IRL); Italy (ITA); Komis from Perm Oblast, Russia (KOM); Kosovo (KOS); Northeast Caucasus (NEC); Netherlands (NLD); Poland (POL); Portugal (PRT); Romania (ROM); Russians from Russia (RUS); Serbia (SER); Southern Bashkirs from Bashkortostan, Russia (SB); Southeastern Bashkirs from Bashkortostan, Russia (SEB); Southwestern Bashkirs from Bashkortostan, Russia (SWB); Slovakia (SVK); Slovenia (SVN); South Sweden (SSW); Spain (ESP); Switzerland (SWI); Tatars from Russia (TAT); Turkey (TUR); Ukraine (UKR).
Similar articles
- Separating the post-Glacial coancestry of European and Asian Y chromosomes within haplogroup R1a.
Underhill PA, Myres NM, Rootsi S, Metspalu M, Zhivotovsky LA, King RJ, Lin AA, Chow CE, Semino O, Battaglia V, Kutuev I, Järve M, Chaubey G, Ayub Q, Mohyuddin A, Mehdi SQ, Sengupta S, Rogaev EI, Khusnutdinova EK, Pshenichnov A, Balanovsky O, Balanovska E, Jeran N, Augustin DH, Baldovic M, Herrera RJ, Thangaraj K, Singh V, Singh L, Majumder P, Rudan P, Primorac D, Villems R, Kivisild T. Underhill PA, et al. Eur J Hum Genet. 2010 Apr;18(4):479-84. doi: 10.1038/ejhg.2009.194. Epub 2009 Nov 4. Eur J Hum Genet. 2010. PMID: 19888303 Free PMC article. - Analysis of the R1b-DF27 haplogroup shows that a large fraction of Iberian Y-chromosome lineages originated recently in situ.
Solé-Morata N, Villaescusa P, García-Fernández C, Font-Porterias N, Illescas MJ, Valverde L, Tassi F, Ghirotto S, Férec C, Rouault K, Jiménez-Moreno S, Martínez-Jarreta B, Pinheiro MF, Zarrabeitia MT, Carracedo Á, de Pancorbo MM, Calafell F. Solé-Morata N, et al. Sci Rep. 2017 Aug 4;7(1):7341. doi: 10.1038/s41598-017-07710-x. Sci Rep. 2017. PMID: 28779148 Free PMC article. - Paternal lineages in southern Iberia provide time frames for gene flow from mainland Europe and the Mediterranean world.
Hernández CL, Dugoujon JM, Sánchez-Martínez LJ, Cuesta P, Novelletto A, Calderón R. Hernández CL, et al. Ann Hum Biol. 2019 Feb;46(1):63-76. doi: 10.1080/03014460.2019.1587507. Epub 2019 Apr 4. Ann Hum Biol. 2019. PMID: 30822152 - Phylogeographic review of Y chromosome haplogroups in Europe.
Navarro-López B, Granizo-Rodríguez E, Palencia-Madrid L, Raffone C, Baeta M, de Pancorbo MM. Navarro-López B, et al. Int J Legal Med. 2021 Sep;135(5):1675-1684. doi: 10.1007/s00414-021-02644-6. Epub 2021 Jul 3. Int J Legal Med. 2021. PMID: 34216266 Review. - Genetic Structure of the Armenian Population.
Yepiskoposyan L, Hovhannisyan A, Khachatryan Z. Yepiskoposyan L, et al. Arch Immunol Ther Exp (Warsz). 2016 Dec;64(Suppl 1):113-116. doi: 10.1007/s00005-016-0431-9. Epub 2017 Jan 12. Arch Immunol Ther Exp (Warsz). 2016. PMID: 28083603 Review.
Cited by
- The genomic portrait of the Picene culture provides new insights into the Italic Iron Age and the legacy of the Roman Empire in Central Italy.
Ravasini F, Kabral H, Solnik A, de Gennaro L, Montinaro F, Hui R, Delpino C, Finocchi S, Giroldini P, Mei O, Beck De Lotto MA, Cilli E, Hajiesmaeil M, Pistacchia L, Risi F, Giacometti C, Scheib CL, Tambets K, Metspalu M, Cruciani F, D'Atanasio E, Trombetta B. Ravasini F, et al. Genome Biol. 2024 Nov 21;25(1):292. doi: 10.1186/s13059-024-03430-4. Genome Biol. 2024. PMID: 39567978 Free PMC article. - Characterization of Y chromosome diversity in newfoundland and labrador: evidence for a structured founding population.
Zurel H, Bhérer C, Batten R, MacMillan ME, Demiriz S, Mirhendi S, Gilbert E, Cavalleri GL, Leach RA, Scott REM, Mugford G, Randhawa R, Symington AL, Stephens JC, Phillips MS. Zurel H, et al. Eur J Hum Genet. 2024 Oct 29. doi: 10.1038/s41431-024-01719-3. Online ahead of print. Eur J Hum Genet. 2024. PMID: 39472688 - Y chromosome sequencing data suggest dual paths of haplogroup N1a1 into Finland.
Preussner A, Leinonen J, Riikonen J, Pirinen M, Tukiainen T. Preussner A, et al. Eur J Hum Genet. 2024 Oct 28. doi: 10.1038/s41431-024-01707-7. Online ahead of print. Eur J Hum Genet. 2024. PMID: 39465313 - A Review of Genetic Diversity Based on the Y Chromosome in the Romanian Population.
Hodișan R, Zaha DC, Jurca C, Petchesi CD, Bembea M. Hodișan R, et al. Cureus. 2024 Aug 23;16(8):e67593. doi: 10.7759/cureus.67593. eCollection 2024 Aug. Cureus. 2024. PMID: 39310605 Free PMC article. Review. - Y-chromosome analysis recapitulates key events of Mediterranean populations.
Navarro-López B, Baeta M, Moreno-López O, Kleinbielen T, Raffone C, Granizo-Rodríguez E, Ferragut JF, Alvarez-Gila O, Barbaro A, Picornell A, de Pancorbo E MM. Navarro-López B, et al. Heliyon. 2024 Jul 26;10(16):e35329. doi: 10.1016/j.heliyon.2024.e35329. eCollection 2024 Aug 30. Heliyon. 2024. PMID: 39220888 Free PMC article.
References
- Underhill PA, Kivisild T. Use of Y chromosome and mitochondrial DNA population structure in tracing human migrations. Annu Rev Genet. 2007;41:539–564. - PubMed
- Novelletto A. Y chromosome variation in Europe: continental and local processes in the formation of the extant gene pool. Ann Hum Biol. 2007;34:139–172. - PubMed
- Jobling MA, Tyler-Smith C. The human Y chromosome: an evolutionary marker comes of age. Nat Rev Genet. 2003;4:598–612. - PubMed
Publication types
MeSH terms
LinkOut - more resources
Full Text Sources
Miscellaneous


