Augmented O-GlcNAc signaling attenuates oxidative stress and calcium overload in cardiomyocytes - PubMed (original) (raw)
Augmented O-GlcNAc signaling attenuates oxidative stress and calcium overload in cardiomyocytes
Gladys A Ngoh et al. Amino Acids. 2011 Mar.
Abstract
O-linked β-N-acetylglucosamine (O-GlcNAc) is an inducible, dynamically cycling and reversible post-translational modification of Ser/Thr residues of nucleocytoplasmic and mitochondrial proteins. We recently discovered that O-GlcNAcylation confers cytoprotection in the heart via attenuating the formation of mitochondrial permeability transition pore (mPTP) and the subsequent loss of mitochondrial membrane potential. Because Ca(2+) overload and reactive oxygen species (ROS) generation are prominent features of post-ischemic injury and favor mPTP formation, we ascertained whether O-GlcNAcylation mitigates mPTP formation via its effects on Ca(2+) overload and ROS generation. Subjecting neonatal rat cardiac myocytes (NRCMs, n ≥ 6 per group) to hypoxia, or mice (n ≥ 4 per group) to myocardial ischemia reduced O-GlcNAcylation, which later increased during reoxygenation/reperfusion. NRCMs (n ≥ 4 per group) infected with an adenovirus carrying nothing (control), adenoviral O-GlcNAc transferase (adds O-GlcNAc to proteins, AdOGT), adenoviral O-GlcNAcase (removes O-GlcNAc to proteins, AdOGA), vehicle or PUGNAc (blocks OGA; increases O-GlcNAc levels) were subjected to hypoxia-reoxygenation or H(2)O(2), and changes in Ca(2+) levels (via Fluo-4AM and Rhod-2AM), ROS (via DCF) and mPTP formation (via calcein-MitoTracker Red colocalization) were assessed using time-lapse fluorescence microscopy. Both OGT and OGA overexpression did not significantly (P > 0.05) alter baseline Ca(2+) or ROS levels. However, AdOGT significantly (P < 0.05) attenuated both hypoxia and oxidative stress-induced Ca(2+) overload and ROS generation. Additionally, OGA inhibition mitigated both H(2)O(2)-induced Ca(2+) overload and ROS generation. Although AdOGA exacerbated both hypoxia and H(2)O(2)-induced ROS generation, it had no effect on H(2)O(2)-induced Ca(2+) overload. We conclude that inhibition of Ca(2+) overload and ROS generation (inducers of mPTP) might be one mechanism through which O-GlcNAcylation reduces ischemia/hypoxia-mediated mPTP formation.
Figures
Figure 1
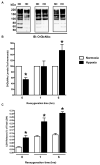
Effects of ischemia-reperfusion injury on level of O-GlcNAcylation. Adult C57BL6 (n=4-6 per group) mice were subjected to 40 minutes of ischemia and reperfused for the indicated time (in hours). A) Representative TAMRA-GlcNAc gels for ischemic zone for time points with significant changes in O-GlcNAcylation. Ischemia induced significant decrement, while reperfusion for one hour augmented O-GlcNAcylation. B) Densitometric quantification of TAMRA-GlcNAc gels expressed as percent of sham for ischemic zones show significant reduction in O-GlcNAcylation following 40 minutes of ischemia (zero hour of reperfusion), augmented O-GlcNAcylation by 1 hour of reperfusion and no change in O-GlcNAcylation by four and twenty four hours of reperfusion compared to Sham. C) There was no significant difference in O-GlcNAcylation in the Non-ischemic zones of MI hearts compared with sham hearts at all reperfusion time points. D) Ischemia induced troponin I (cTnI) release. *p<0.05 vs. Sham
Figure 2
Effects of hypoxia-reoxygenation on O-GlcNAc levels. Myocytes were subjected to hypoxia for three hours and reoxygenated for zero, one or six hours. O-GlcNAcylation levels were assessed on whole cell lysates or cell injury assessed by measuring post-hypoxic LDH release in the media. A) Representative immunoblots of time course of O-GlcNAcylation levels in cardiac myocytes. B) Densitometric quantification of O-GlcNAc immunoblots expressed as percent of normoxic control. C) Hypoxia induced cell injury according to post-hypoxic LDH release.
Figure 3
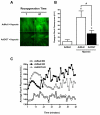
Evaluation of ROS production in NRCMs treated with AdNull, AdOGT, AdOGA, Vehicle or PUGNAc using DCF (n=6/group). Hypoxia induced ROS production. AdOGT significantly attenuated, while AdOGA exacerbated, hypoxia-induced ROS production. OGA inhibition with PUGNAc also reduced post-hypoxic ROS generation. A. Representative montage showing DCF fluorescence. B. Bar graph showing the change in DCF fluorescent intensity between 1 and 61 minutes. C. Quantitative changes in mean DCF fluorescence in NRCMs exposed to AdNull, AdOGT, or AdOGA using time-lapse fluorescent microscopy. D. Representative montage showing DCF fluorescence for Vehicle vs. PUGNAc. E. Bar graph showing the change in DCF fluorescent intensity between 1 and 61 minutes for Vehicle vs. PUGNAc. F. Quantitative changes in mean DCF fluorescence in NRCMs exposed to Vehicle or PUGNAc using time-lapse fluorescent microscopy. *p<0.05 vs. AdNull or Vehicle, #p<0.05 vs. AdNull + Hypoxia or Vehicle + hypoxia.
Figure 4
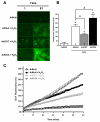
Assessment of effects of manipulation of O-GlcNAc signaling on H2O2-induced ROS generation. NRCMs treated with AdNull, AdOGT, AdOGA, Vehicle, or PUGNAc were subjected to oxidative stress (with H2O2) and ROS levels measured using DCF (n=4 per group). AdOGT significantly attenuated, while AdOGA exacerbated, H2O2-induced ROS production. OGA inhibition with PUGNAc also reduced H2O2-induced ROS production. A. Representative montage showing DCF fluorescence for AdNull, AdOGT and AdOGA treated NRCMs. B. Bar graph showing the change in DCF fluorescent intensity between 1 and 61 minutes for AdNull, AdOGT and AdOGA treated NRCMs. C. Quantitative changes in mean DCF fluorescence in NRCMs exposed to AdNull, AdOGT, or AdOGA using time-lapse fluorescent microscopy. D. Representative montage showing DCF fluorescence for Vehicle vs. PUGNAc. E. Bar graph showing the change in DCF fluorescent intensity between 1 and 61 minutes for Vehicle vs. PUGNAc. F. Quantitative changes in mean DCF fluorescence in NRCMs exposed to Vehicle or PUGNAc using time-lapse fluorescent microscopy. *p<0.05 vs. AdNull or Vehicle, #p<0.05 vs. AdNull + H2O2 or Vehicle + H2O2.
Figure 5
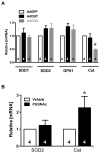
Evaluation of anti-oxidant enzymes by qRT-PCR in NRCMs treated with AdGFP, AdOGT, AdOGA, Vehicle, or PUGNAc. A. No change in mRNA levels of the anti-oxidant enzymes SOD1, SOD2, GPX or Cat occurred with either AdGFP or AdOGT. AdOGA did not affect SOD1, SOD2 or GPX but did significantly reduce Cat. B. Inhibition of OGA with PUGNAc did not affect SOD2 levels but did increase Cat mRNA. * p<0.05 vs. AdGFP or Vehicle.
Figure 6
Evaluation of calcium overload in NRCMs treated with AdNull or AdOGT and subjected to hypoxia/reoxygenation. AdOGT significantly attenuated cytosolic and mitochondrial Ca2+ overload. A. Representative montage showing fluo-4 fluorescence for AdNull and AdOGT treated NRCMs. B. Bar graph showing the change in fluo-4 fluorescent intensity between 1 and 61 minutes for AdNull and AdOGT. C. Time-lapse graph of mean fluo-4 fluorescence in NRCMs treated with AdNull or AdOGT and exposed to hypoxia/reoxygenation. D. Representative montage showing rhod-2 fluorescence for AdNull or AdOGT treated NRCMs. E. Bar graph showing the change in rhod-2 fluorescent intensity between 1 and 61 minutes for AdNull or AdOGT treated NRCMs F. Quantitative changes in mean DCF fluorescence in NRCMs exposed to AdNull or AdOGT using time-lapse fluorescent microscopy. *p<0.05 vs. AdNull, #p<0.05 vs. AdNull + hypoxia/reoxygenation.
Figure 7
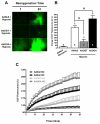
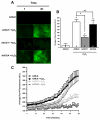
Evaluation of calcium overload in NRCMs treated with AdNull, AdOGT, AdOGA, Vehicle, or PUGNAc and subjected oxidative stress using fluo-4 (n=6 per group). AdOGT significantly attenuated, while, AdOGA did not affect H2O2-induced cytosolic Ca2+ overload. OGA inhibition with PUGNAc also reduced H2O2-induced cytosolic Ca2+ overload. A. Representative montage showing fluo-4 fluorescence for AdNull, AdOGT, and AdOGA treated NRCMs. B. Bar graph showing the change in fluo-4 fluorescent intensity between 1 and 61 minutes for AdNull, AdOGT and AdOGA treated NRCMs. C. Time-lapse graph of mean fluo-4 fluorescence in NRCMs treated with AdNull, AdOGT, or AdOGA and exposed to H2O2. D. Representative montage showing fluo-4 fluorescence for Vehicle vs. PUGNAc. E. Bar graph showing the change in fluo-4 fluorescent intensity between 1 and 61 minutes for Vehicle vs. PUGNAc – treated NRCMs. F. Quantitative changes in mean DCF fluorescence in NRCMs exposed to Vehicle or PUGNAc using time-lapse fluorescent microscopy. *p<0.05 vs. AdNull or Vehicle, #p<0.05 vs. AdNull + H2O2 or Vehicle + H2O2.
Figure 8
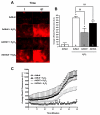
Evaluation of mitochondrial calcium overload in NRCMs treated with AdNull, AdOGT, AdOGA, Vehicle, or PUGNAc and subjected oxidative stress using rhod-2 (n=6 per group). AdOGT significantly attenuated, while, AdOGA did not affect H2O2-induced mitochondrial Ca2+ overload. OGA inhibition with PUGNAc also reduced H2O2-induced mitochondrial Ca2+ overload. A. Representative montage showing rhod-2 fluorescence for AdNull, AdOGT, and AdOGA treated NRCMs. B. Bar graph showing the change in rhod-2 fluorescent intensity between 1 and 61 minutes for AdNull, AdOGT and AdOGA treated NRCMs. C) Time-lapse graph of mean rhod-2 fluorescence in NRCMs treated with AdNull, AdOGT, or AdOGA and exposed to H2O2. D. Representative montage showing rhod-2 fluorescence for Vehicle vs. PUGNAc. E. Bar graph showing changes in rhod-2 fluorescent intensity between 1 and 61 minutes for Vehicle vs. PUGNAc –treated NRCMs. F. Quantitative changes in mean DCF fluorescence in NRCMs exposed to Vehicle or PUGNAc using time-lapse fluorescent microscopy. *p<0.05 vs. AdNull or Vehicle, #p<0.05 vs. AdNull + H2O2 or Vehicle + H2O2.
Figure 9
Assessment of peroxide induced calcium overload in NRCMs exposed to a low (50μmol/L) concentration of H2O2. A. Cytosolic calcium levels as shown by fluo-4 fluorescence. B. Mitochondrial calcium levels as shown by rhod-2 fluorescence. C. Change in fluorescence in both fluo-4 and rhod-2.
Figure 10
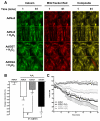
Assessment of sensitivity to formation of mitochondrial permeability transition pore (mPTP) in NRCMs treated with AdNull, AdOGT, AdOGA, Vehicle, or PUGNAc prior to H2O2 treatment using calcein and MitoTracker Red. Loss of calcein fluorescence was used to indicate mPTP (n>/=6 per group). H2O2 treatment induced mPTP opening, which was attenuated by OGT overexpression or exacerbated by OGA overexpression according to: A. Representative montages, B. Quantitative bar graph showing the change in calcein fluorescent intensity SD between 1 and 61 minutes, and C. Graph showing time dependent changes in mean calcein fluorescence intensity standard deviation in NRCMs treated with AdNull, AdNull + H2O2, AdOGT + H2O2, and AdOGA + H2O2. OGA inhibition with PUGNAc also mitigated mPTP formation according to: D. Representative montages of calcein fluorescence, E. Quantitative bar graph showing the change in calcein fluorescent intensity SD between 1 and 61 minutes, and F. Graph showing time dependent changes in mean calcein fluorescence intensity standard deviation in NRCMs treated with Vehicle, Vehicle + H2O2, and PUGNAc + H2O2. *p<0.05 vs. AdNull or Vehicle or #p<0.05 vs. AdNull + H2O2 or Vehicle + H2O2.
Similar articles
- Non-canonical glycosyltransferase modulates post-hypoxic cardiac myocyte death and mitochondrial permeability transition.
Ngoh GA, Watson LJ, Facundo HT, Dillmann W, Jones SP. Ngoh GA, et al. J Mol Cell Cardiol. 2008 Aug;45(2):313-25. doi: 10.1016/j.yjmcc.2008.04.009. Epub 2008 May 2. J Mol Cell Cardiol. 2008. PMID: 18539296 Free PMC article. - Danhong injection protects cardiomyocytes against hypoxia/reoxygenation- and H2O2-induced injury by inhibiting mitochondrial permeability transition pore opening.
Duan ZZ, Li YH, Li YY, Fan GW, Chang YX, Yu B, Gao XM. Duan ZZ, et al. J Ethnopharmacol. 2015 Dec 4;175:617-25. doi: 10.1016/j.jep.2015.08.033. Epub 2015 Aug 29. J Ethnopharmacol. 2015. PMID: 26320687 - Glucosamine protects neonatal cardiomyocytes from ischemia-reperfusion injury via increased protein O-GlcNAc and increased mitochondrial Bcl-2.
Champattanachai V, Marchase RB, Chatham JC. Champattanachai V, et al. Am J Physiol Cell Physiol. 2008 Jun;294(6):C1509-20. doi: 10.1152/ajpcell.00456.2007. Epub 2008 Mar 26. Am J Physiol Cell Physiol. 2008. PMID: 18367586 Free PMC article. - The Role of O-GlcNAcylation for Protection against Ischemia-Reperfusion Injury.
Jensen RV, Andreadou I, Hausenloy DJ, Bøtker HE. Jensen RV, et al. Int J Mol Sci. 2019 Jan 18;20(2):404. doi: 10.3390/ijms20020404. Int J Mol Sci. 2019. PMID: 30669312 Free PMC article. Review. - O-linked beta-N-acetylglucosamine (O-GlcNAc): Extensive crosstalk with phosphorylation to regulate signaling and transcription in response to nutrients and stress.
Butkinaree C, Park K, Hart GW. Butkinaree C, et al. Biochim Biophys Acta. 2010 Feb;1800(2):96-106. doi: 10.1016/j.bbagen.2009.07.018. Epub 2009 Aug 6. Biochim Biophys Acta. 2010. PMID: 19647786 Free PMC article. Review.
Cited by
- Chronic O-GlcNAcylation and Diabetic Cardiomyopathy: The Bitterness of Glucose.
Ducheix S, Magré J, Cariou B, Prieur X. Ducheix S, et al. Front Endocrinol (Lausanne). 2018 Oct 29;9:642. doi: 10.3389/fendo.2018.00642. eCollection 2018. Front Endocrinol (Lausanne). 2018. PMID: 30420836 Free PMC article. Review. - Mitochondrial and Contractile Function of Human Right Atrial Tissue in Response to Remote Ischemic Conditioning.
Kleinbongard P, Gedik N, Kirca M, Stoian L, Frey U, Zandi A, Thielmann M, Jakob H, Peters J, Kamler M, Heusch G. Kleinbongard P, et al. J Am Heart Assoc. 2018 Aug 7;7(15):e009540. doi: 10.1161/JAHA.118.009540. J Am Heart Assoc. 2018. PMID: 30371229 Free PMC article. - Finding the missing link between the unfolded protein response and O-GlcNAcylation in the heart.
Glembotski CC. Glembotski CC. Circ Res. 2014 Aug 29;115(6):546-8. doi: 10.1161/CIRCRESAHA.114.304855. Circ Res. 2014. PMID: 25170091 Free PMC article. - Is age a key factor contributing to the disparity between success of neuroprotective strategies in young animals and limited success in elderly stroke patients? Focus on protein homeostasis.
Yang W, Paschen W. Yang W, et al. J Cereb Blood Flow Metab. 2017 Oct;37(10):3318-3324. doi: 10.1177/0271678X17723783. Epub 2017 Jul 28. J Cereb Blood Flow Metab. 2017. PMID: 28752781 Free PMC article. Review. - The regulatory roles of O-GlcNAcylation in mitochondrial homeostasis and metabolic syndrome.
Zhao L, Feng Z, Yang X, Liu J. Zhao L, et al. Free Radic Res. 2016 Oct;50(10):1080-1088. doi: 10.1080/10715762.2016.1239017. Epub 2016 Oct 19. Free Radic Res. 2016. PMID: 27646831 Free PMC article. Review.
References
- Halestrap AP. Does the mitochondrial permeability transition have a role in preconditioning? Circulation. 2004;110:e303. author reply e303. - PubMed
- Crow MT, Mani K, Nam YJ, Kitsis RN. The mitochondrial death pathway and cardiac myocyte apoptosis. Circ Res. 2004;95:957–970. - PubMed
- Di Lisa F, Menabo R, Canton M, Barile M, Bernardi P. Opening of the mitochondrial permeability transition pore causes depletion of mitochondrial and cytosolic nad+ and is a causative event in the death of myocytes in postischemic reperfusion of the heart. J Biol Chem. 2001;276:2571–2575. - PubMed
- Wang G, Liem DA, Vondriska TM, Honda HM, Korge P, Pantaleon DM, Qiao X, Wang Y, Weiss JN, Ping P. Nitric oxide donors protect murine myocardium against infarction via modulation of mitochondrial permeability transition. Am J Physiol Heart Circ Physiol. 2005;288:H1290–1295. - PubMed
MeSH terms
Substances
LinkOut - more resources
Full Text Sources
Other Literature Sources
Miscellaneous

