Accumbens Homer2-mediated signaling: a factor contributing to mouse strain differences in alcohol drinking? - PubMed (original) (raw)
Accumbens Homer2-mediated signaling: a factor contributing to mouse strain differences in alcohol drinking?
S P Goulding et al. Genes Brain Behav. 2011 Feb.
Abstract
Alcohol-induced increases in nucleus accumbens glutamate actively regulate alcohol consumption, and the alcohol responsiveness of corticoaccumbens glutamate systems relates to genetic variance in alcohol reward. Here, we extend earlier data for inbred mouse strain differences in accumbens glutamate by examining for differences in basal and alcohol-induced changes in the striatal expression of glutamate-related signaling molecules between inbred C57BL/6J and DBA2/J mice. Repeated alcohol treatment (8 × 2 g/kg) increased the expression of Group1 metabotropic glutamate receptors, the NR2a/b subunits of the N-methyl-D-aspartate receptor, Homer2a/b, as well as the activated forms of protein kinase C (PKC) epsilon and phosphoinositol-3-kinase within ventral, but not dorsal, striatum. Regardless of prior alcohol experience, C57BL/6J mice exhibited higher accumbens levels of mGluR1/5, Homer2a/b, NR2a and activated kinases vs. DBA2/J mice, whereas an alcohol-induced rise in dorsal striatum mGluR1/5 expression was observed only in C57BL/6J mice. We next employed virus-mediated gene transfer approaches to ascertain the functional relevance of the observed strain difference in accumbens Homer2 expression for B6/D2 differences in alcohol-induced glutamate sensitization, as well as alcohol preference/intake. Manipulating nucleus accumbens shell Homer2b expression actively regulated these measures in C57BL/6J mice, whereas DBA2/J mice were relatively insensitive to the neurochemical and behavioral effects of virus-mediated changes in Homer2 expression. These data support the over-arching hypothesis that augmented accumbens Homer2-mediated glutamate signaling may be an endophenotype related to genetic variance in alcohol consumption. If relevant to humans, such data pose polymorphisms affecting glutamate receptor/Homer2 signaling in the etiology of alcoholism.
© 2010 The Authors. Genes, Brain and Behavior © 2010 Blackwell Publishing Ltd and International Behavioural and Neural Genetics Society.
Figures
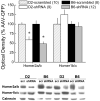
Figure 1. Quantification of the extent of NAC Homer2 knock-down by AAV-shRNA
top, Summary of the average (± SEM) protein levels of Homer2a/b, Homer1b/c (negative control) and calnexin (loading control) in the NAC observed in B6 and D2 mice at 2 months following a 0.5 μl/side infusion of AAVs carrying either a scrambled control vector (scrambled; scr) or an shRNA against Homer2b (shRNA). The optical density of the shRNA-infused animals was normalized to their respective scrambled controls to facilitate B6–D2 comparisons in the magnitude of shRNA-mediated knock-down. bottom, Representative immunoblots for the 3 proteins of interest in scrambled (scr)- and shRNA-infused B6 and D2 mice. Sample sizes employed in the analysis of the data are indicated in the figure. *p<0.05 vs. respective scrambled control.
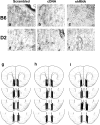
Figure 2. Verfication of neuronal transfection by AAV constructs and probe placements
a–f, Representative 20× micrographs of immunostaining for HA-tagged Homer2b in the left NAC shell of B6 mice (a–c) and D2 mice (d–f) infused with AAVs carrying scrambled control vectors (scrambled), cDNA carrying Homer2b (cDNA) or shRNA against Homer2b (shRNA). g–i, Localization of the active membranes of the microdialysis probes within the NAC shell respectively of scrambled, cDNA and shRNA-infused mice. Closed bars represent placements in B6 mice, while open bars represent placements in D2 mice.
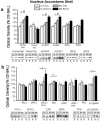
Figure 3. Strain differences in NAC shell protein expression
a, Representative immunoblots for, and summary of, the effects of strain and repeated alcohol (EtOH) treatment (8 × 2 g/kg, IP) upon the total protein levels of Homer2a/b, Homer1b/c, mGluR1, mGluR5, NR2a, and NR2b within the shell subregion of the NAC. b, Representative immunoblots for, and summary of, the corresponding changes in the total protein expression of PKCε, p(Ser729)PKCε, ERK1/2, p(Tyr204)ERK, PI3K, and the p(Tyr)p85α PI3K binding motif [p(Tyr)p85α], as well as the ratios of activated vs. total PKCε and ERK expression. For both panels, the data are expressed as a percent of the average optical band density of D2 mice injected repeatedly with saline (D2-SAL). All bars represent the mean ± SEM of 10–12 mice/group. # indicates EtOH>SAL (main effect of alcohol treatment), p<0.05; + indicates B6>D2 (main effect of strain), p<0.05.
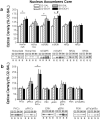
Figure 4. Strain differences in NAC core protein expression
a, Representative immunoblots for, and summary of, the effects of strain and repeated alcohol (EtOH) treatment (8 × 2 g/kg, IP) upon the total protein levels of Homer2a/b, Homer1b/c, mGluR1, mGluR5, NR2a, and NR2b within the core subregion of the NAC. b, Representative immunoblots for, and summary of, the corresponding changes in the total protein expression of PKCε, p(Ser729)PKCε, ERK1/2, p(Tyr204)ERK, PI3K, and the p(Tyr)p85α PI3K binding motif [p(Tyr)p85α], as well as the ratios of activated vs. total PKCε and ERK expression. For both panels, the data are expressed as a percent of the average optical band density of D2 mice injected repeatedly with saline (D2-SAL). All bars represent the mean ± SEM of 10–12 mice/group. # indicates EtOH>SAL (main effect of alcohol treatment), p<0.05; + indicates B6>D2 (main effect of strain), p<0.05.
Figure 5. No strain differences in dorsal striatal protein expression
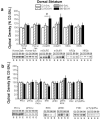
a, Representative immunoblots for, and summary of, the effects of strain and repeated alcohol (EtOH) treatment (8 × 2 g/kg, IP) upon the total protein levels of Homer2a/b, Homer1b/c, mGluR1, mGluR5, NR2a, and NR2b within the dorsal striatum. b, Representative immunoblots for, and summary of, the corresponding changes in the total protein expression of PKCε, p(Ser729)PKCε, ERK1/2, p(Tyr204)ERK, PI3K, and the p(Tyr)p85α PI3K binding motif [p(Tyr)p85α], as well as the ratios of activated vs. total PKCε and ERK expression. For both panels, the data are expressed as a percent of the average optical band density of D2 mice injected repeatedly with saline (D2-SAL). All bars represent the mean ± SEM of 10–12 mice/group. + indicates EtOH>SAL (main effect of alcohol treatment), p<0.05.
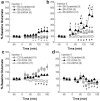
Figure 6. Strain differences in the effects of AAV-mediated changes in accumbens alcohol-induced glutamate release
Summary of the alcohol-induced changes in NAC shell extracellular levels of glutamate observed on injections 1 (left panel) and 8 (right panel) of repeated alcohol treatment (8 × 2 g/kg, IP) observed in the NAC shell of AAV-treated B6 (top panel) and D2 (bottom panel) mice. a & b, In B6 mice, Homer2b cDNA infusion potentiated the glutamate response to acute alcohol and potentiated the expression of alcohol-induced glutamate sensitization, while Homer2b shRNA infusion prevented the development of alcohol-induced glutamate sensitization. c & d, In D2 mice, shRNA infusion lowered the glutamate response to acute alcohol, but neither AAV affected alcohol-induced changes in glutamate on injection 8 of repeated treatment. Note the larger ordinate in panels a & b (B6 data) versus c & d (D2 data). Data points represent the mean ± SEM of the number of mice indicated in the figure. *p<0.05 vs. Scrambled control; +p<0.05 vs. B6; #p<0.05 vs. Injection 1 (sensitization or tolerance).
Figure 7. Strain differences in the effects of AAV-mediated changes in alcohol preference and intake
a, Summary of the effects of AAV treatment upon the relative preference for 3, 6, 12 or 18% alcohol (v/v) versus water exhibited by B6 (solid bars) and D2 (open bars) mice. b, Summary of the effects of AAV treatment upon the alcohol intake (expressed as g/kg body weight) exhibited by the mice over a 24-hr period. c, Summary of the effects of AAV treatment upon the total water intake (expressed as ml/kg body weight) exhibited by the mice over a 24-hr period. All bars represent the mean ± SEM of the number of mice indicated in the figure. *p<0.05 vs. Scrambled control.
Similar articles
- Binge drinking upregulates accumbens mGluR5-Homer2-PI3K signaling: functional implications for alcoholism.
Cozzoli DK, Goulding SP, Zhang PW, Xiao B, Hu JH, Ary AW, Obara I, Rahn A, Abou-Ziab H, Tyrrel B, Marini C, Yoneyama N, Metten P, Snelling C, Dehoff MH, Crabbe JC, Finn DA, Klugmann M, Worley PF, Szumlinski KK. Cozzoli DK, et al. J Neurosci. 2009 Jul 8;29(27):8655-68. doi: 10.1523/JNEUROSCI.5900-08.2009. J Neurosci. 2009. PMID: 19587272 Free PMC article. - Nucleus accumbens mGluR5-associated signaling regulates binge alcohol drinking under drinking-in-the-dark procedures.
Cozzoli DK, Courson J, Caruana AL, Miller BW, Greentree DI, Thompson AB, Wroten MG, Zhang PW, Xiao B, Hu JH, Klugmann M, Metten P, Worley PF, Crabbe JC, Szumlinski KK. Cozzoli DK, et al. Alcohol Clin Exp Res. 2012 Sep;36(9):1623-33. doi: 10.1111/j.1530-0277.2012.01776.x. Epub 2012 Mar 20. Alcohol Clin Exp Res. 2012. PMID: 22432643 Free PMC article. - Strain differences in alcohol-induced neurochemical plasticity: a role for accumbens glutamate in alcohol intake.
Kapasova Z, Szumlinski KK. Kapasova Z, et al. Alcohol Clin Exp Res. 2008 Apr;32(4):617-31. doi: 10.1111/j.1530-0277.2008.00620.x. Epub 2008 Mar 13. Alcohol Clin Exp Res. 2008. PMID: 18341649 - Homer2 gene deletion in mice produces a phenotype similar to chronic cocaine treated rats.
Kalivas PW, Szumlinski KK, Worley P. Kalivas PW, et al. Neurotox Res. 2004;6(5):385-7. doi: 10.1007/BF03033313. Neurotox Res. 2004. PMID: 15545022 Review. - Homer2 and Alcohol: A Mutual Interaction.
Castelli V, Brancato A, Cavallaro A, Lavanco G, Cannizzaro C. Castelli V, et al. Front Psychiatry. 2017 Nov 30;8:268. doi: 10.3389/fpsyt.2017.00268. eCollection 2017. Front Psychiatry. 2017. PMID: 29249995 Free PMC article. Review.
Cited by
- Homers at the Interface between Reward and Pain.
Obara I, Goulding SP, Gould AT, Lominac KD, Hu JH, Zhang PW, von Jonquieres G, Dehoff M, Xiao B, Seeburg PH, Worley PF, Klugmann M, Szumlinski KK. Obara I, et al. Front Psychiatry. 2013 Jun 7;4:39. doi: 10.3389/fpsyt.2013.00039. eCollection 2013. Front Psychiatry. 2013. PMID: 23761764 Free PMC article. - Homer2 regulates alcohol and stress cross-sensitization.
Quadir SG, Santos JR, Campbell RR, Wroten MG, Singh N, Holloway JJ, Bal SK, Camarini R, Szumlinski KK. Quadir SG, et al. Addict Biol. 2016 May;21(3):613-33. doi: 10.1111/adb.12252. Epub 2015 Apr 27. Addict Biol. 2016. PMID: 25916683 Free PMC article. - Testing support models for implementing an evidence-based digital intervention for alcohol use disorder: results of a pragmatic hybrid implementation-effectiveness trial.
Quanbeck A, Chih MY, Park L, Li X, Xie Q, Pulvermacher A, Voelker S, Lundwall R, Eby K, Barrett B, Brown R. Quanbeck A, et al. Res Sq [Preprint]. 2024 Mar 28:rs.3.rs-4004555. doi: 10.21203/rs.3.rs-4004555/v1. Res Sq. 2024. PMID: 38585768 Free PMC article. Updated. Preprint. - Allosteric modulation of metabotropic glutamate receptors in alcohol use disorder: Insights from preclinical investigations.
Johnson KA, Lovinger DM. Johnson KA, et al. Adv Pharmacol. 2020;88:193-232. doi: 10.1016/bs.apha.2020.02.002. Epub 2020 Mar 2. Adv Pharmacol. 2020. PMID: 32416868 Free PMC article. Review. - Deficits in ventromedial prefrontal cortex group 1 metabotropic glutamate receptor function mediate resistance to extinction during protracted withdrawal from an extensive history of cocaine self-administration.
Ben-Shahar O, Sacramento AD, Miller BW, Webb SM, Wroten MG, Silva HE, Caruana AL, Gordon EJ, Ploense KL, Ditzhazy J, Kippin TE, Szumlinski KK. Ben-Shahar O, et al. J Neurosci. 2013 Jan 9;33(2):495-506a. doi: 10.1523/JNEUROSCI.3710-12.2013. J Neurosci. 2013. PMID: 23303930 Free PMC article.
References
- Ary AW, Aguilar VR, Szumlinski KK, Kippin TE. Prenatal stress alters limbo-corticostriatal Homer protein expression. Synapse. 2007;61:938–941. - PubMed
- Ary AW, Szumlinski KK. Regional differences in the effects of withdrawal from repeated cocaine upon Homer and glutamate receptor expression: A two-species comparison. Brain Res. 2007;1184:295–305. - PubMed
- Backstrom P, Bachteler D, Koch S, Hyytia P, Spanagel R. mGluR5 antagonist MPEP reduces ethanol-seeking and relapse behavior. Neuropsychopharmacology. 2004;29:921–928. - PubMed
- Backstrom P, Hyytia P. Ionotropic glutamate receptor antagonists modulate cue-induced reinstatement of ethanol-seeking behavior. Alcohol Clin Exp Res. 2004;28:558–65. - PubMed
Publication types
MeSH terms
Substances
Grants and funding
- R01 AA016650/AA/NIAAA NIH HHS/United States
- AA016650/AA/NIAAA NIH HHS/United States
- AA015351/AA/NIAAA NIH HHS/United States
- R01 DA024038/DA/NIDA NIH HHS/United States
- U01 AA016650/AA/NIAAA NIH HHS/United States
- R21 AA015351/AA/NIAAA NIH HHS/United States
LinkOut - more resources
Full Text Sources
Medical
Molecular Biology Databases
