Integrating common and rare genetic variation in diverse human populations - PubMed (original) (raw)
. 2010 Sep 2;467(7311):52-8.
doi: 10.1038/nature09298.
David M Altshuler, Richard A Gibbs, Leena Peltonen, David M Altshuler, Richard A Gibbs, Leena Peltonen, Emmanouil Dermitzakis, Stephen F Schaffner, Fuli Yu, Leena Peltonen, Emmanouil Dermitzakis, Penelope E Bonnen, David M Altshuler, Richard A Gibbs, Paul I W de Bakker, Panos Deloukas, Stacey B Gabriel, Rhian Gwilliam, Sarah Hunt, Michael Inouye, Xiaoming Jia, Aarno Palotie, Melissa Parkin, Pamela Whittaker, Fuli Yu, Kyle Chang, Alicia Hawes, Lora R Lewis, Yanru Ren, David Wheeler, Richard A Gibbs, Donna Marie Muzny, Chris Barnes, Katayoon Darvishi, Matthew Hurles, Joshua M Korn, Kati Kristiansson, Charles Lee, Steven A McCarrol, James Nemesh, Emmanouil Dermitzakis, Alon Keinan, Stephen B Montgomery, Samuela Pollack, Alkes L Price, Nicole Soranzo, Penelope E Bonnen, Richard A Gibbs, Claudia Gonzaga-Jauregui, Alon Keinan, Alkes L Price, Fuli Yu, Verneri Anttila, Wendy Brodeur, Mark J Daly, Stephen Leslie, Gil McVean, Loukas Moutsianas, Huy Nguyen, Stephen F Schaffner, Qingrun Zhang, Mohammed J R Ghori, Ralph McGinnis, William McLaren, Samuela Pollack, Alkes L Price, Stephen F Schaffner, Fumihiko Takeuchi, Sharon R Grossman, Ilya Shlyakhter, Elizabeth B Hostetter, Pardis C Sabeti, Clement A Adebamowo, Morris W Foster, Deborah R Gordon, Julio Licinio, Maria Cristina Manca, Patricia A Marshall, Ichiro Matsuda, Duncan Ngare, Vivian Ota Wang, Deepa Reddy, Charles N Rotimi, Charmaine D Royal, Richard R Sharp, Changqing Zeng, Lisa D Brooks, Jean E McEwen
Affiliations
- PMID: 20811451
- PMCID: PMC3173859
- DOI: 10.1038/nature09298
Integrating common and rare genetic variation in diverse human populations
International HapMap 3 Consortium et al. Nature. 2010.
Abstract
Despite great progress in identifying genetic variants that influence human disease, most inherited risk remains unexplained. A more complete understanding requires genome-wide studies that fully examine less common alleles in populations with a wide range of ancestry. To inform the design and interpretation of such studies, we genotyped 1.6 million common single nucleotide polymorphisms (SNPs) in 1,184 reference individuals from 11 global populations, and sequenced ten 100-kilobase regions in 692 of these individuals. This integrated data set of common and rare alleles, called 'HapMap 3', includes both SNPs and copy number polymorphisms (CNPs). We characterized population-specific differences among low-frequency variants, measured the improvement in imputation accuracy afforded by the larger reference panel, especially in imputing SNPs with a minor allele frequency of <or=5%, and demonstrated the feasibility of imputing newly discovered CNPs and SNPs. This expanded public resource of genome variants in global populations supports deeper interrogation of genomic variation and its role in human disease, and serves as a step towards a high-resolution map of the landscape of human genetic variation.
Figures
Figure 1. Size and frequency spectra of common and rare CNPs
a, Estimated size distribution of common CNPs calculated from the physical span of the genomic probes supporting each CNP event. b, Allele frequency spectrum for biallelic CNPs calculated from integer CNP genotypes for the samples analysed in this work.
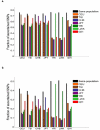
Figure 2. SNP discovery informativeness across populations
a, b, For each of 7 populations for which at least 60 individuals were resequenced, we considered a sample of 30 individuals, another non-overlapping sample of 30 individuals from the same population, and a sample of 30 individuals from each of the 6 other populations (results are averaged over 1,000 random samplings). Out of all SNPs that are either polymorphic (a) or polymorphic with a minor allele with at most two copies in the sample of 30 individuals (b), here we present the fraction that are also polymorphic in a different sample, starting with the other sample from the same population (black bars). The black bars serve as a baseline that accounts for the effect of sampling stochasticity and sequencing errors on SNP discovery. The different _y_-axis scales used reflect the lower likelihood of a low-frequency variant being seen in a different sample.
Figure 3. Effect of sample size on SNP ascertainment
The number of SNPs discovered as a function of sample size by averaging over 1,000 random samplings. For each population, we randomly sampled without replacement a subset of the individuals of any possible size and considered which SNPs were polymorphic in the resequencing data for that sample. For any given sample size, many more variants are discovered in populations with genetic proximity to Africa (LWK, ASW and YRI), compared to populations of non-African ancestry.
Figure 4. Haplotype sharing around SNPs and CNPs
a, b, Extent of haplotype homozygosity around variant alleles of various frequencies. Shown are SNPs from the ENCODE sequence, CNPs of comparable frequency, SNPs from the arrays and on randomly grouped chromosomes, and (for YRI) the maximum possible sharing for a genotyping error rate of 0.2%. a, CEU. b, YRI.
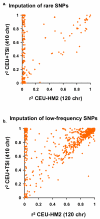
Figure 5. Imputation accuracy and reference panel size
a, b, Mean _r_2 between true and imputed genotype dosage for SNPs imputed from a HapMap-II-sized panel of 120 CEU chromosomes (HMII-CEU) or a HapMap 3 panel of 410 European-ancestry chromosomes (CEU+TSI). Scatter plots show Affymetrix 500K SNPs on chromosome 20 imputed for 1,393 subjects of the 1958 British birth cohort. a, Rare SNPs (MAF <0.5%). b, Low-frequency SNPs (MAF = 0.5–5%).
Figure 6. Imputation: new populations, new variants
a, b, Mean _r_2 between true and imputed genotype dosage as a function of copies of minor allele in the reference panel. a, The loss in imputation accuracy when the reference population differs slightly from the target population (CEU imputed into CEU compared to CEU into TSI; and YRI into YRI compared to YRI into LWK). b, Imputation accuracy for newly discovered variants (CNPs and ENCODE SNPs).
Comment in
- Expanding HapMap.
Rusk N. Rusk N. Nat Methods. 2010 Oct;7(10):780-1. doi: 10.1038/nmeth1010-780b. Nat Methods. 2010. PMID: 20936772 No abstract available.
Similar articles
- Integrated detection and population-genetic analysis of SNPs and copy number variation.
McCarroll SA, Kuruvilla FG, Korn JM, Cawley S, Nemesh J, Wysoker A, Shapero MH, de Bakker PI, Maller JB, Kirby A, Elliott AL, Parkin M, Hubbell E, Webster T, Mei R, Veitch J, Collins PJ, Handsaker R, Lincoln S, Nizzari M, Blume J, Jones KW, Rava R, Daly MJ, Gabriel SB, Altshuler D. McCarroll SA, et al. Nat Genet. 2008 Oct;40(10):1166-74. doi: 10.1038/ng.238. Epub 2008 Sep 7. Nat Genet. 2008. PMID: 18776908 - Founder population-specific HapMap panel increases power in GWA studies through improved imputation accuracy and CNV tagging.
Surakka I, Kristiansson K, Anttila V, Inouye M, Barnes C, Moutsianas L, Salomaa V, Daly M, Palotie A, Peltonen L, Ripatti S. Surakka I, et al. Genome Res. 2010 Oct;20(10):1344-51. doi: 10.1101/gr.106534.110. Epub 2010 Sep 1. Genome Res. 2010. PMID: 20810666 Free PMC article. - A comparison of cataloged variation between International HapMap Consortium and 1000 Genomes Project data.
Buchanan CC, Torstenson ES, Bush WS, Ritchie MD. Buchanan CC, et al. J Am Med Inform Assoc. 2012 Mar-Apr;19(2):289-94. doi: 10.1136/amiajnl-2011-000652. J Am Med Inform Assoc. 2012. PMID: 22319179 Free PMC article. - [DNA polymorphisms].
Suehiro Y, Furuya T, Sasaki K, Hinota Y. Suehiro Y, et al. Rinsho Byori. 2013 Nov;61(11):1001-7. Rinsho Byori. 2013. PMID: 24450105 Review. Japanese. - Copy number variants in pharmacogenetic genes.
He Y, Hoskins JM, McLeod HL. He Y, et al. Trends Mol Med. 2011 May;17(5):244-51. doi: 10.1016/j.molmed.2011.01.007. Epub 2011 Mar 8. Trends Mol Med. 2011. PMID: 21388883 Free PMC article. Review.
Cited by
- Gene-environment interactions in the influence of maternal education on adolescent neurodevelopment using ABCD study.
Shi R, Chang X, Banaschewski T, Barker GJ, Bokde ALW, Desrivières S, Flor H, Grigis A, Garavan H, Gowland P, Heinz A, Brühl R, Martinot JL, Martinot MP, Artiges E, Nees F, Orfanos DP, Poustka L, Hohmann S, Holz N, Smolka MN, Vaidya N, Walter H, Whelan R, Schumann G, Lin X, Feng J; IMAGEN Consortium. Shi R, et al. Sci Adv. 2024 Nov 15;10(46):eadp3751. doi: 10.1126/sciadv.adp3751. Epub 2024 Nov 15. Sci Adv. 2024. PMID: 39546599 Free PMC article. - Nested admixture during and after the Trans-Atlantic Slave Trade on the island of São Tomé.
Ciccarella M, Laurent R, Szpiech ZA, Patin E, Dessarps-Freichey F, Utgé J, Lémée L, Semo A, Rocha J, Verdu P. Ciccarella M, et al. bioRxiv [Preprint]. 2024 Oct 23:2024.10.21.619344. doi: 10.1101/2024.10.21.619344. bioRxiv. 2024. PMID: 39484499 Free PMC article. Preprint. - Multivariate genomic analysis of 5 million people elucidates the genetic architecture of shared components of the metabolic syndrome.
Park S, Kim S, Kim B, Kim DS, Kim J, Ahn Y, Kim H, Song M, Shim I, Jung SH, Cho C, Lim S, Hong S, Jo H, Fahed AC, Natarajan P, Ellinor PT, Torkamani A, Park WY, Yu TY, Myung W, Won HH. Park S, et al. Nat Genet. 2024 Nov;56(11):2380-2391. doi: 10.1038/s41588-024-01933-1. Epub 2024 Sep 30. Nat Genet. 2024. PMID: 39349817 Free PMC article. - Gene discovery and biological insights into anxiety disorders from a large-scale multi-ancestry genome-wide association study.
Friligkou E, Løkhammer S, Cabrera-Mendoza B, Shen J, He J, Deiana G, Zanoaga MD, Asgel Z, Pilcher A, Di Lascio L, Makharashvili A, Koller D, Tylee DS, Pathak GA, Polimanti R. Friligkou E, et al. Nat Genet. 2024 Oct;56(10):2036-2045. doi: 10.1038/s41588-024-01908-2. Epub 2024 Sep 18. Nat Genet. 2024. PMID: 39294497 - Phenotype wide association study links bronchopulmonary dysplasia with eosinophilia in children.
Kelchtermans J, March ME, Hakonarson H, McGrath-Morrow SA. Kelchtermans J, et al. Sci Rep. 2024 Sep 13;14(1):21391. doi: 10.1038/s41598-024-72348-5. Sci Rep. 2024. PMID: 39271728 Free PMC article.
References
- International Human Genome Sequencing Consortium Initial sequencing and analysis of the human genome. Nature. 2001;409:860–921. - PubMed
- The Internation SNP Map Working Group A map of human genome sequence variation containing 1.42 million single nucleotide polymorphisms. Nature. 2001;409:928–933. - PubMed
- Donnelly P. Progress and challenges in genome-wide association studies in humans. Nature. 2008;456:728–731. - PubMed
Publication types
MeSH terms
Grants and funding
- P30 DK043351/DK/NIDDK NIH HHS/United States
- 068545/Z/02/WT_/Wellcome Trust/United Kingdom
- 082371/WT_/Wellcome Trust/United Kingdom
- 068545/WT_/Wellcome Trust/United Kingdom
- 077014/WT_/Wellcome Trust/United Kingdom
- G0000934/MRC_/Medical Research Council/United Kingdom
- 077011/WT_/Wellcome Trust/United Kingdom
- 076113/WT_/Wellcome Trust/United Kingdom
- U54 HG003273/HG/NHGRI NIH HHS/United States
- 091746/WT_/Wellcome Trust/United Kingdom
- 089062/WT_/Wellcome Trust/United Kingdom
- WT_/Wellcome Trust/United Kingdom
- 089061/WT_/Wellcome Trust/United Kingdom
LinkOut - more resources
Full Text Sources
Other Literature Sources


