Piezo1 and Piezo2 are essential components of distinct mechanically activated cation channels - PubMed (original) (raw)
Piezo1 and Piezo2 are essential components of distinct mechanically activated cation channels
Bertrand Coste et al. Science. 2010.
Abstract
Mechanical stimuli drive many physiological processes, including touch and pain sensation, hearing, and blood pressure regulation. Mechanically activated (MA) cation channel activities have been recorded in many cells, but the responsible molecules have not been identified. We characterized a rapidly adapting MA current in a mouse neuroblastoma cell line. Expression profiling and RNA interference knockdown of candidate genes identified Piezo1 (Fam38A) to be required for MA currents in these cells. Piezo1 and related Piezo2 (Fam38B) are vertebrate multipass transmembrane proteins with homologs in invertebrates, plants, and protozoa. Overexpression of mouse Piezo1 or Piezo2 induced two kinetically distinct MA currents. Piezos are expressed in several tissues, and knockdown of Piezo2 in dorsal root ganglia neurons specifically reduced rapidly adapting MA currents. We propose that Piezos are components of MA cation channels.
Figures
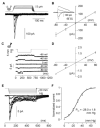
Fig. 1. Mechanically-activated currents in Neuro2A cells
(A) Representative traces of mechanically-activated (MA) inward currents expressed in Neuro2A (N2A) cells. Cells were subjected to a series of mechanical steps of 1 μm movements of a stimulation pipette (inset drawing, arrow) in the whole-cell patch configuration at a holding potential of −80 mV. (B) Average current-voltage relationships of MA currents in N2A (n = 11) cells. Inset, representative MA currents evoked at holding potentials ranging from −80 to +40 mV (applied 0.7 sec prior to the mechanical step). (C) Single-channel currents (cell attached patch configuration) induced by negative pressure with a pipette (inset drawing, arrow) at holding potentials ranging from −80 mV to +80 mV in a N2A cell. (D) Average current-voltage relationships of stretch-activated single channels in N2A cells (n = 4, mean ± SEM). Single channel conductance was calculated from the slope of the linear regression line of each cell giving γ = 22.9 ± 1.4pS (mean ± SEM). Single channel amplitude was determined as the amplitude difference in Gaussian fits of full trace histograms. (E) Representative currents (averaged traces) induced by negative pipette pressure (0 to −60 mm Hg, Δ 10 mm Hg) in a N2A cell. (F) Normalized current-pressure relationship of stretch activated currents at −80 mV fitted with a Boltzmann equation (n = 21). P50 is the average value of P50s from individual cells.
Fig. 2. Suppression of mechanically-activated currents by Piezo1 (Fam38A) siRNA
(A) Average maximal amplitude of MA inward currents elicited at a holding potential of −80mV in N2A cells transfected with scrambled siRNA (blue dot, n = 56), Piezo1 (Fam38A) siRNA (red dot, n = 20) or siRNA directed against other candidates tested (open symbols, list of candidates available in Table S1). For each candidate, black circle and error bar represents the mean ± SEM, n = 4-27 each. The black line represents the average value of all cells tested (n = 807) and the two blue dashed lines represent 4-fold decrease or increase of this value. (B) Average maximal amplitude of MA inward currents elicited at a holding potential of −80 mV in N2A cells transfected either with scrambled siRNA (blue) or different Piezo1 (Fam38A) siRNAs (red). Smart-pool I is composed of four siRNAs including siRNA 1, 2 and 3. ***, P < 0.001, Kruskal-Wallis test. Inset: Representative traces of MA inward currents expressed in N2A cells transfected with scrambled siRNA (blue trace) or Piezo1 (Fam38A) siRNA (red trace) at a holding potential of −80 mV. (C) Representative currents (averaged traces) induced by negative pipette pressure (0 to −60 mm Hg, Δ 10 mm Hg, cell attached) in a N2A cell transfected with scrambled siRNA (left panel) or Piezo1 siRNA (right panel). Traces of current elicited by −60 mm Hg are highlighted in blue and red. (D) Average maximal amplitude of stretch-activated currents elicited at a holding potential of −80 mV in N2A cells transfected with scrambled siRNA (blue) or Piezo1 siRNA (red). Bars represent the mean ± SEM, and the number of cells tested is shown above the bars. **, P < 0.01, unpaired t-test with Welch’s correction.
Fig. 3. Evolutionary conservation and expression profile of mouse Piezo1 and Piezo2
(A) Unrooted phylogenetic tree showing sequence relationship of different members of the Piezo family of proteins. The alignments were generated using Megalign and DrawTree programs. The dotted line represents an artificially extended line to accommodate fit. Hs, Homo Sapiens; Mm, Mouse musculus; Gg, Gallus gallus, Dr, Danio Rerio; Ci, Ciona intestinalis; Dm, Drosophila melanogaster; Ce, Caenorhabditis elegans; Dd, Dictyostelium discoideum; At, Arabidopsis thaliana; Os, Oryza sativa; Tt, Tetrahymena thermophila (accession numbers are provided in Methods). Protista is referred to as a single kingdom, but can be considered as a group of diverse phyla (B) mRNA expression profiles of Piezo1 (upper panel) and Piezo2 (lower panel) determined by qPCR from various adult mouse tissues. GAPDH was used as the reference gene and lung as the tissue calibrator using the 2−ΔΔCT method. Each bar is the mean + SEM of the average of two separate experiments.
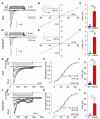
Fig. 4. Large mechanically-activated currents from cells overexpressing Piezo1
(A-F) MA currents of Piezo1-expressing N2A (A-C) and HEK293T (D-F) cells recorded in the whole-cell configuration. (A, D) Representative traces of MA inward currents expressed in different cell types transfected with Piezo1. Cells were subjected to a series of mechanical steps in 1 μm (A) or 0.5 μm (D) increments using glass probe stimulation and at a holding potential of −80 mV. (B, E) Representative current-voltage relationships of MA currents expressed in different cell types transfected with Piezo1. Inset, MA currents evoked at holding potentials ranging from −80 to +40 mV. (C, F) Average maximal amplitude of MA inward currents elicited at a holding potential of −80 mV in Piezo1-transfected (red) or mock-transfected (blue) cells. Bars represent the mean ± SEM, and the number of cells tested is shown above the bars. ***, P < 0.001, unpaired t-test with Welch’s correction. (G-L) Stretch-activated currents of mouse Piezo1- expressing N2A (G-I) and HEK293T (J-L) cells in cell-attached configuration. Representative averaged currents induced by negative pipette pressure (0 to −60 mm Hg, Δ 10 mm Hg) in a N2A (G) and HEK293T (J) cells transfected with Piezo1. Imax normalized current-pressure relationship of stretch-activated currents elicited at −80 mV in Piezo1-transfected N2A (H, n = 12) and HEK293T (K, n = 11) cells and fitted with a Boltzmann equation. P50 is the average value of all P50s determined for individual cells. Average maximal amplitude of stretch-activated currents elicited at a holding potential of −80 mV in N2A (I) and HEK293T (L) cells mock-transfected (blue) or transfected with Piezo1 (red). Bars represent the mean ± SEM, and the number of cells tested is shown above the bars. ***, P < 0.001. **, P < 0.01, unpaired t-test with Welch’s correction.
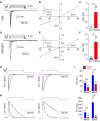
Fig. 5. Piezo2-dependent large mechanically-activated currents kinetically distinct from Piezo1-induced currents
(A-F) MA currents of Piezo2-expressing N2A (A-C) and HEK293T (D-F) cells in whole-cell configuration. In N2A cells, Piezo2 or vector only were transfected with Piezo1 siRNA to suppress endogenous Piezo1-dependent MA currents. (A, D) Representative traces of MA inward currents expressed in different cell types transfected with Piezo2. Cells were subjected to a series of mechanical steps of 1 μm movements of a glass probe at a holding potential of −80 mV. (B, E) Representative current-voltage relationships of MA currents expressed in different cell types transfected with Piezo2. Inset, MA currents evoked at holding potentials ranging from −80 to +40 mV. (C, F) Average maximal amplitude of MA inward currents elicited at a holding potential of −80mV in Piezo1-transfected (red) or mock-transfected (blue) cells. (G-H) Representative traces of mechanically-activated inward (G) or outward (H) currents expressed in cells transfected with Piezo1 (blue trace) or Piezo2 (red trace) at the specified holding potentials. Traces were normalized to the peak current, and dashed lines represent fits of inactivation with a mono-exponential equation. (I) Time-constant of inactivation of Piezo1 (blue) and Piezo2 (red) at negative (−80 and −40 mV, upper panel) and positive (40 and 80 mV, lower panel) holding potentials. Bars represent the mean ± SEM and the numbers above bars the number of cells. **, P < 0.01. ***, P < 0.001, unpaired t-test with Welch’s correction.
Fig. 6. Sensitivity of fast-inactivating MA currents in DRG neurons to depletion of Piezo2
(A) Representative images of colorimetric in situ hybridization for Piezo2 in Dorsal Root Ganglia (DRG) neurons using antisense (left panel) and sense (right panel) probes. (B) Representative traces of three typical MA inward currents expressed in DRG neurons are characterized by distinct inactivation kinetics. Neurons were subjected to a series of mechanical steps in 1 μm increments at a holding potential of −80 mV. Current inactivation was fitted with a bi-exponential equation giving fast time-constant (τ) of 7.3 ms and slow time-constant > 100ms (left panel), or with a mono-exponential equation giving a time constant of 27 ms (middle panel). Some currents with τ >30 ms are too slow to be efficiently fitted during the 150 ms lasting step stimulation (right panel). (C-D) Frequency histograms indicating the proportion of neurons transfected with scrambled siRNA (Ctr) or Piezo2 siRNA (siRNA) that respond to mechanical stimulation with MA currents characterized by their inactivation kinetic. Bars represent the mean ± SEM of the proportion of neurons from seven separate experiments (B, n = 12-19 neurons per condition and per experiment) or the proportion from all neurons pooled from all seven experiments (C); the numbers above bars in C represent the number of neurons. **, P < 0.01; ns, not significantly different; unpaired t test.
Comment in
- Mechanical Signals as Regulators of Cartilage Degeneration and Regeneration.
Rai MF, Stoddart MJ, Guilak F. Rai MF, et al. J Am Acad Orthop Surg. 2017 Apr;25(4):e87-e89. doi: 10.5435/JAAOS-D-16-00938. J Am Acad Orthop Surg. 2017. PMID: 28291148 No abstract available.
Similar articles
- Regulation of Piezo2 Mechanotransduction by Static Plasma Membrane Tension in Primary Afferent Neurons.
Jia Z, Ikeda R, Ling J, Viatchenko-Karpinski V, Gu JG. Jia Z, et al. J Biol Chem. 2016 Apr 22;291(17):9087-104. doi: 10.1074/jbc.M115.692384. Epub 2016 Feb 29. J Biol Chem. 2016. PMID: 26929410 Free PMC article. - Piezo2 voltage-block regulates mechanical pain sensitivity.
Sánchez-Carranza O, Chakrabarti S, Kühnemund J, Schwaller F, Bégay V, García-Contreras JA, Wang L, Lewin GR. Sánchez-Carranza O, et al. Brain. 2024 Oct 3;147(10):3487-3500. doi: 10.1093/brain/awae227. Brain. 2024. PMID: 38984717 Free PMC article. - TMEM120A/TACAN inhibits mechanically activated PIEZO2 channels.
Del Rosario JS, Gabrielle M, Yudin Y, Rohacs T. Del Rosario JS, et al. J Gen Physiol. 2022 Aug 1;154(8):e202213164. doi: 10.1085/jgp.202213164. Epub 2022 Jul 12. J Gen Physiol. 2022. PMID: 35819364 Free PMC article. - The role of PIEZO ion channels in the musculoskeletal system.
Savadipour A, Palmer D, Ely EV, Collins KH, Garcia-Castorena JM, Harissa Z, Kim YS, Oestrich A, Qu F, Rashidi N, Guilak F. Savadipour A, et al. Am J Physiol Cell Physiol. 2023 Mar 1;324(3):C728-C740. doi: 10.1152/ajpcell.00544.2022. Epub 2023 Jan 30. Am J Physiol Cell Physiol. 2023. PMID: 36717101 Free PMC article. Review. - Touch, Tension, and Transduction - The Function and Regulation of Piezo Ion Channels.
Wu J, Lewis AH, Grandl J. Wu J, et al. Trends Biochem Sci. 2017 Jan;42(1):57-71. doi: 10.1016/j.tibs.2016.09.004. Epub 2016 Oct 12. Trends Biochem Sci. 2017. PMID: 27743844 Free PMC article. Review.
Cited by
- Piezo1 facilitates the initiation and progression of renal fibrosis by mediating cell apoptosis and mitochondrial dysfunction.
Zhang Y, Lv L, Zhou Z, Zhang H, Li Q, Yang S, Wen Y, Wang Q, Feng J, Lu W, Jia W, Wen JG. Zhang Y, et al. Ren Fail. 2024 Dec;46(2):2415519. doi: 10.1080/0886022X.2024.2415519. Epub 2024 Nov 4. Ren Fail. 2024. PMID: 39496543 Free PMC article. - Cyst formation in proximal renal tubules caused by dysfunction of the microtubule minus-end regulator CAMSAP3.
Mitsuhata Y, Abe T, Misaki K, Nakajima Y, Kiriya K, Kawasaki M, Kiyonari H, Takeichi M, Toya M, Sato M. Mitsuhata Y, et al. Sci Rep. 2021 Mar 12;11(1):5857. doi: 10.1038/s41598-021-85416-x. Sci Rep. 2021. PMID: 33712686 Free PMC article. - The mechanics of the retina: Müller glia role on retinal extracellular matrix and modelling.
Prieto-López L, Pereiro X, Vecino E. Prieto-López L, et al. Front Med (Lausanne). 2024 Sep 4;11:1393057. doi: 10.3389/fmed.2024.1393057. eCollection 2024. Front Med (Lausanne). 2024. PMID: 39296899 Free PMC article. Review. - Mechanochemical regulation of growth cone motility.
Kerstein PC, Nichol RH IV, Gomez TM. Kerstein PC, et al. Front Cell Neurosci. 2015 Jul 7;9:244. doi: 10.3389/fncel.2015.00244. eCollection 2015. Front Cell Neurosci. 2015. PMID: 26217175 Free PMC article. Review. - Membrane potential and Ca2+ concentration dependence on pressure and vasoactive agents in arterial smooth muscle: A model.
Karlin A. Karlin A. J Gen Physiol. 2015 Jul;146(1):79-96. doi: 10.1085/jgp.201511380. J Gen Physiol. 2015. PMID: 26123196 Free PMC article.
References
- Chalfie M. Nat Rev Mol Cell Biol. 2009 Jan;10:44. - PubMed
- Hamill OP, Martinac B. Physiol Rev. 2001 Apr;81:685. - PubMed
- Monshausen GB, Gilroy S. Trends Cell Biol. 2009 May;19:228. - PubMed
- Iwatsuki K, Hirano T. Comp Biochem Physiol A Physiol. 1995 Feb;110:167. - PubMed
Publication types
MeSH terms
Substances
Grants and funding
- DE016927/DE/NIDCR NIH HHS/United States
- R01 DE016927/DE/NIDCR NIH HHS/United States
- R01 NS046303/NS/NINDS NIH HHS/United States
- R01 NS046303-08/NS/NINDS NIH HHS/United States
- NS046303/NS/NINDS NIH HHS/United States
LinkOut - more resources
Full Text Sources
Other Literature Sources
Molecular Biology Databases
Research Materials


