SIRT1 deacetylates and inhibits SREBP-1C activity in regulation of hepatic lipid metabolism - PubMed (original) (raw)
SIRT1 deacetylates and inhibits SREBP-1C activity in regulation of hepatic lipid metabolism
Bhaskar Ponugoti et al. J Biol Chem. 2010.
Abstract
The SIRT1 deacetylase inhibits fat synthesis and stimulates fat oxidation in response to fasting, but the underlying mechanisms remain unclear. Here we report that SREBP-1c, a key lipogenic activator, is an in vivo target of SIRT1. SIRT1 interaction with SREBP-1c was increased during fasting and decreased upon feeding, and consistently, SREBP-1c acetylation levels were decreased during fasting in mouse liver. Acetylated SREBP-1c levels were also increased in HepG2 cells treated with insulin and glucose to mimic feeding conditions, and down-regulation of p300 by siRNA decreased the acetylation. Depletion of hepatic SIRT1 by adenoviral siRNA increased acetylation of SREBP-1c with increased lipogenic gene expression. Tandem mass spectrometry and mutagenesis studies revealed that SREBP-1c is acetylated by p300 at Lys-289 and Lys-309. Mechanistic studies using acetylation-defective mutants showed that SIRT1 deacetylates and inhibits SREBP-1c transactivation by decreasing its stability and its occupancy at the lipogenic genes. Remarkably, SREBP-1c acetylation levels were elevated in diet-induced obese mice, and hepatic overexpression of SIRT1 or treatment with resveratrol, a SIRT1 activator, daily for 1 week decreased acetylated SREBP-1c levels with beneficial functional outcomes. These results demonstrate an intriguing connection between elevated SREBP-1c acetylation and increased lipogenic gene expression, suggesting that abnormally elevated SREBP-1c acetylation increases SREBP-1c lipogenic activity in obese mice. Reducing acetylation of SREBP-1c by targeting SIRT1 may be useful for treating metabolic disorders, including fatty liver, obesity, and type II diabetes.
Figures
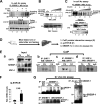
FIGURE 1.
SIRT1 directly interacts with and deacetylates SREBP-1c. A, a schematic diagram of full-length SIRT1 and deletion mutants. B, purified GST or GST-SIRT1 fusion proteins that had been bound to glutathione-Sepharose were incubated with 35S-labeled SREBP-1c, and after washing, bound proteins were eluted and analyzed by SDS-PAGE followed by autoradiography. C, experimental outline of in vitro deacetylation assays. D, FLAG-SREBP-1c, acetylated by p300, was further incubated with GST control or GST-SIRT1 in the absence or presence of NAD+, and acetylated FLAG-SREBP-1c and FLAG-SREBP-1c in input samples were detected by Western analysis (bottom). E–G, COS-1 (E and F) or Hepa1c1c7 cells (G) were co-transfected with FLAG-SREBP-1c and p300 expression plasmids with SIRT1 plasmids as indicated, and 36 h later, in-cell acetylation assays were performed. SREBP-1c was immunoprecipitated from cell extracts under stringent conditions using SDS-containing buffers, and acetylated SREBP-1c was detected by Western analysis. Duplicates are shown. Band intensities of acetylated SREBP-1c were quantified using the ImageJ program, and the values from control samples were set to 1. Statistical significance was determined using Student's t test. *, p < 0.05 (n = 3). aa, amino acids; Ab, antibody; WB, Western blot; IP, immunoprecipitation. Error bars, S.E.
FIGURE 2.
Down-regulation of SIRT1 increases acetylated SREBP-1c levels in vivo. A, the experimental procedure is shown. Mice were injected with Ad-siSIRT1 or control Ad-empty via tail veins, and 7 days later, mice were fasted overnight, and livers were collected for further analysis. B, Western blotting was performed to detect hepatic SIRT1 protein levels. C, endogenous SREBP-1c was immunoprecipitated, and acetylated SREBP-1c levels were detected by Western analysis. Duplicates are shown. D, band intensities of acetylated and total SREBP-1 were determined using ImageJ software, and acetylated SREBP-1 levels relative to total levels from the mice infected with Ad-empty were set to 1. Statistical significance was determined by Student's t test. *, p < 0.05 (n = 3). E, the mRNA levels of the indicated genes were determined by real-time quantitative RT-PCR in the same livers used for in vivo acetylation assays. Statistical significance was determined by Student's t test. * and NS, p < 0.05 and statistically not significant, respectively (n = 5). IP, immunoprecipitation. Error bars, S.E.
FIGURE 3.
SREBP-1 acetylation is increased under conditions that mimic feeding in a p300-dependent manner. A, HepG2 cells were treated with vehicle or Nam (10 m
m
) for 3 h and further treated with insulin (100 n
m
) and glucose (25 m
m
) for 30 min. Then cells were collected, and acetylation assays were carried out as described in the legend to Fig. 1. Acetylated endogenous SREBP-1 levels were detected by Western analysis. B and C, HepG2 cells were infected with Ad-sip300, and 48 h later, cells were treated with the HDAC inhibitors trichostatin A and Nam for 3 h and further treated with insulin and glucose. Protein levels of p300, SREBP-1, and acetylated endogenous SREBP-1 were detected. D, experimental outline. E (a), protein levels in input samples were detected by Western analysis. E (b, c, and d), co-IP protein interaction studies were done using antibodies as indicated. F, the mRNA levels of FAS were measured by quantitative RT-PCR. Statistical significance was determined using Student's t test. *, p < 0.05 (n = 3). G, endogenous SREBP-1c was immunoprecipitated and acetylated SREBP-1c levels were detected (left). Conversely, acetylated proteins were immunoprecipitated by acetyl-Lys antibody, and then acetylated SREBP-1c proteins were detected using SREBP-1 antibody (right). IP, immunoprecipitation; WB, Western blot. Error bars, S.E.
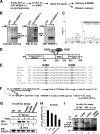
FIGURE 4.
Lys-289 and Lys-309 are the major sites in SREBP-1c acetylated by p300. A, the experimental protocol for MS/MS analysis is outlined. B, purified GST or GST-SREBP-1c was incubated with p300, and proteins were separated using SDS-PAGE followed by Western analysis. C, MS/MS analysis of acetylated SREBP-1c is shown, which identifies Lys-289 as a site acetylated by p300. D, a schematic diagram of the acetylation sites in SREBP-1c. E, alignments of the SREBP-1c region containing Lys-289 or Lys-309 from different vertebrates. F, outline of experimental protocols. G, COS-1 cells were transfected with plasmids as indicated, and acetylation assays were performed as described in the legend to Fig. 1. H, band intensities of acetylated SREBP-1c were quantified, and the values from wild type samples were set to 1. Consistent results were observed from two additional assays. I, in vitro acetylation assays were performed as described under “Experimental Procedures.” Acetylated FLAG-SREBP-1c was detected by Western analysis. IP, immunoprecipitation; WB, Western blot. Error bars, S.E.
FIGURE 5.
SIRT1 decreases SREBP-1c stability, which is correlated with increased ubiquitination. A and B, Hepa1c1c7 cells were transfected with plasmids as indicated, and in-cell ubiquitination assays were performed. FLAG-SREBP-1c was immunoprecipitated in SDS-containing buffers, and ubiquitinated FLAG-SREBP-1c was detected by Western analysis. Ubiquitinated FLAG-SREBP-1c is indicated by a dotted line. FLAG-SREBP-1c levels in input are shown at the bottom. In B, acetylated SREBP-1c levels were detected by Western analysis using acetyl-Lys antibody. C–I, CHX experiments. COS-1 cells were transfected with plasmids as indicated, and 36 h later, cells were treated with CHX for the indicated times, and SREBP-1 levels were detected. Membranes were stripped, and tubulin levels were detected. D and I, band intensities were measured and normalized to the values from the zero time points, which were set to 1. Consistent results were observed from two independent CHX assays. Ub, ubiquitin; IP, immunoprecipitation; WB, Western blot.
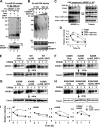
FIGURE 6.
SIRT1 decreases occupancy of SREBP-1c at the Fas and Srebp-1c gene promoters. A, HepG2 cells were transfected with plasmids, as indicated, using electroporation, and association of SREBP-1c or RNA pol II at the Fas and Srebp-1c promoters was detected by ChIP assays. B, the mRNA levels of Fas and Srebp-1c genes were detected by quantitative RT-PCR in parallel. Statistical significance was determined by Student's t test. *, p < 0.05 (n = 3). C, the experimental procedure is outlined. D and E, HepG2 cells were transfected with SREBP-1c wild type or mutant plasmids using electroporation as indicated. Cells were treated with insulin (100 n
m
) for 30 min and collected for ChIP assays to detect occupancy of SREBP-1c at the Fas promoter (D), Srebp-1c promoter (F), or GAPDH coding region (E). Consistent results were observed from two independent assays. IP, immunoprecipitation. Error bars, S.E.
FIGURE 7.
Acetylated SREBP-1c levels are highly elevated in diet-induced obese (DIO) mice. A, the experimental procedure. B, protein levels were determined by Western analysis. Results from two mice are shown. C, endogenous SREBP-1c was immunoprecipitated and acetylated SREBP-1c was detected by Western analysis. D, band intensities of acetylated and total SREBP-1 were measured, and acetylated SREBP-1 levels relative to total levels were calculated. E, the mRNA levels of the indicated genes were determined by quantitative RT-PCR. Statistical significance was determined by Student's t test (n = 4). *, **, and NS, p < 0.05, p < 0.01, and statistically not significant, respectively. IP, immunoprecipitation; WB, Western blot. Error bars, S.E.
FIGURE 8.
Overexpression of SIRT1 in obese mice decreases SREBP-1c acetylation levels. A, outline of the experimental protocol. B, protein levels of FLAG-SIRT1 were detected by Western blotting. C–E, endogenous SREBP-1c was immunoprecipitated from liver extracts from obese mice overexpressing FLAG-SIRT1 (C) or mice treated orally with resveratrol daily for 1 week (E). Acetylated SREBP-1c levels were detected by Western analysis. D, band intensities of acetylated and total SREBP-1 were measured, and acetylated SREBP-1 levels relative to total levels were calculated. F, the mRNA levels of indicated genes were determined by quantitative RT-PCR. D and F, statistical significance was determined by Student's t test, and S.E. was calculated (n = 3). * and **, p < 0.05 and p < 0.01, respectively. IP, immunoprecipitation; WB, Western blot. Error bars, S.E.
Similar articles
- Sirtuin 1 regulates SREBP-1c expression in a LXR-dependent manner in skeletal muscle.
Defour A, Dessalle K, Castro Perez A, Poyot T, Castells J, Gallot YS, Durand C, Euthine V, Gu Y, Béchet D, Peinnequin A, Lefai E, Freyssenet D. Defour A, et al. PLoS One. 2012;7(9):e43490. doi: 10.1371/journal.pone.0043490. Epub 2012 Sep 11. PLoS One. 2012. PMID: 22984430 Free PMC article. - Conserved role of SIRT1 orthologs in fasting-dependent inhibition of the lipid/cholesterol regulator SREBP.
Walker AK, Yang F, Jiang K, Ji JY, Watts JL, Purushotham A, Boss O, Hirsch ML, Ribich S, Smith JJ, Israelian K, Westphal CH, Rodgers JT, Shioda T, Elson SL, Mulligan P, Najafi-Shoushtari H, Black JC, Thakur JK, Kadyk LC, Whetstine JR, Mostoslavsky R, Puigserver P, Li X, Dyson NJ, Hart AC, Näär AM. Walker AK, et al. Genes Dev. 2010 Jul 1;24(13):1403-17. doi: 10.1101/gad.1901210. Genes Dev. 2010. PMID: 20595232 Free PMC article. - Involvement of mammalian sirtuin 1 in the action of ethanol in the liver.
You M, Liang X, Ajmo JM, Ness GC. You M, et al. Am J Physiol Gastrointest Liver Physiol. 2008 Apr;294(4):G892-8. doi: 10.1152/ajpgi.00575.2007. Epub 2008 Jan 31. Am J Physiol Gastrointest Liver Physiol. 2008. PMID: 18239056 - Oxymatrine reduces hepatic lipid synthesis in rat model of nonalcoholic steatohepatitis by regulating Sirt1/AMPK and LXR/Plin2/SREBP-1c pathways.
Xiong J, Chen G, He Y, Zhao C, Chen D, Liu Y, Zhang Z, Wu Y, Xu H. Xiong J, et al. Chem Biol Interact. 2025 Feb 1;407:111370. doi: 10.1016/j.cbi.2024.111370. Epub 2024 Dec 31. Chem Biol Interact. 2025. PMID: 39746502
Cited by
- Signal Transduction and Molecular Regulation in Fatty Liver Disease.
Dong XC, Chowdhury K, Huang M, Kim HG. Dong XC, et al. Antioxid Redox Signal. 2021 Sep 20;35(9):689-717. doi: 10.1089/ars.2021.0076. Epub 2021 Jun 3. Antioxid Redox Signal. 2021. PMID: 33906425 Free PMC article. - CircHIPK3 relieves vascular calcification via mediating SIRT1/PGC-1α/MFN2 pathway by interacting with FUS.
Feng S, Qi Y, Xiao Z, Chen H, Liu S, Luo H, Wu H, Zhang W. Feng S, et al. BMC Cardiovasc Disord. 2023 Nov 27;23(1):583. doi: 10.1186/s12872-023-03602-3. BMC Cardiovasc Disord. 2023. PMID: 38012555 Free PMC article. - The dual role of sirtuins in cancer: biological functions and implications.
Yu L, Li Y, Song S, Zhang Y, Wang Y, Wang H, Yang Z, Wang Y. Yu L, et al. Front Oncol. 2024 Jun 14;14:1384928. doi: 10.3389/fonc.2024.1384928. eCollection 2024. Front Oncol. 2024. PMID: 38947884 Free PMC article. Review. - MicroRNA-217 promotes ethanol-induced fat accumulation in hepatocytes by down-regulating SIRT1.
Yin H, Hu M, Zhang R, Shen Z, Flatow L, You M. Yin H, et al. J Biol Chem. 2012 Mar 23;287(13):9817-9826. doi: 10.1074/jbc.M111.333534. Epub 2012 Feb 3. J Biol Chem. 2012. PMID: 22308024 Free PMC article. - Nutrient sensor-mediated programmed nonalcoholic fatty liver disease in low birthweight offspring.
Wolfe D, Gong M, Han G, Magee TR, Ross MG, Desai M. Wolfe D, et al. Am J Obstet Gynecol. 2012 Oct;207(4):308.e1-6. doi: 10.1016/j.ajog.2012.07.033. Epub 2012 Jul 31. Am J Obstet Gynecol. 2012. PMID: 22921094 Free PMC article.
References
- Sinclair D. A., Lin S. J., Guarente L. (2006) Science 312, 195–197 - PubMed
- Yamamoto H., Schoonjans K., Auwerx J. (2007) Mol. Endocrinol. 21, 1745–1755 - PubMed
- Guarente L. (2007) Cold Spring Harb. Symp. Quant. Biol. 72, 483–488 - PubMed
Publication types
MeSH terms
Substances
Grants and funding
- R01 DK080032/DK/NIDDK NIH HHS/United States
- DK80032/DK/NIDDK NIH HHS/United States
- N01 CO012400/CA/NCI NIH HHS/United States
- R01 DK062777/DK/NIDDK NIH HHS/United States
- R01 CA103867/CA/NCI NIH HHS/United States
- N01-CO-12400/CO/NCI NIH HHS/United States
- R01 CA124760/CA/NCI NIH HHS/United States
- CA124760/CA/NCI NIH HHS/United States
- CA103867/CA/NCI NIH HHS/United States
- DK062777/DK/NIDDK NIH HHS/United States
- R56 DK062777/DK/NIDDK NIH HHS/United States
LinkOut - more resources
Full Text Sources
Molecular Biology Databases
Miscellaneous


