Identification and characterization of two novel primate-specific histone H3 variants, H3.X and H3.Y - PubMed (original) (raw)
. 2010 Sep 6;190(5):777-91.
doi: 10.1083/jcb.201002043.
Silke N Mildner, Clemens Bönisch, Lars Israel, Andreas Maiser, Sarah Matheisl, Tobias Straub, Rainer Merkl, Heinrich Leonhardt, Elisabeth Kremmer, Lothar Schermelleh, Sandra B Hake
Affiliations
- PMID: 20819935
- PMCID: PMC2935562
- DOI: 10.1083/jcb.201002043
Identification and characterization of two novel primate-specific histone H3 variants, H3.X and H3.Y
Sonja M Wiedemann et al. J Cell Biol. 2010.
Abstract
Nucleosomal incorporation of specialized histone variants is an important mechanism to generate different functional chromatin states. Here, we describe the identification and characterization of two novel primate-specific histone H3 variants, H3.X and H3.Y. Their messenger RNAs are found in certain human cell lines, in addition to several normal and malignant human tissues. In keeping with their primate specificity, H3.X and H3.Y are detected in different brain regions. Transgenic H3.X and H3.Y proteins are stably incorporated into chromatin in a similar fashion to the known H3 variants. Importantly, we demonstrate biochemically and by mass spectrometry that endogenous H3.Y protein exists in vivo, and that stress stimuli, such as starvation and cellular density, increase the abundance of H3.Y-expressing cells. Global transcriptome analysis revealed that knockdown of H3.Y affects cell growth and leads to changes in the expression of many genes involved in cell cycle control. Thus, H3.Y is a novel histone variant involved in the regulation of cellular responses to outside stimuli.
Figures
Figure 1.
Sequence and mRNA expression analysis of novel H3 variants H3.X and H3.Y. (A) Amino acid sequence alignment of human histone variants H3.1, H3.2, and H3.3 with novel variants H3.X and H3.Y. Alignments were made with ClustalW Alignment (MacVector 10.0.2). Identical amino acids are highlighted in dark gray, similar amino acids are highlighted in light gray, and changes are set apart on a white background. The black bar indicates the peptide sequence used for antibody generation. Black stars mark known PTM sites in H3.1, H3.2, and H3.3. The gray star indicates an H3.3-specific modification site. Amino acid numbers are indicated on top. (B) qPCR analysis with cDNA from different human cell lines shows expression of H3.Y and to a lesser extent H3.X mRNA in U2OS cells. Primer pair H3.X+Y (dark gray) specifically recognizes H3.X and H3.Y nucleotide sequences, whereas another primer pair is H3.X specific (H3.X, light gray). NIH3T3 mouse cDNA was used as a negative control. Data were normalized to HPRT1 and HMBS expression levels. Controls generated without reverse transcription were used to assess amplification threshold. Error bars represent SEM of two independent biological experiments. (C) Expression of H3.X and H3.Y mRNA in normal and malignant human tissues. Commercially available total RNA from human tissues was analyzed for H3.X+Y and H3.X expression in qPCR experiments and compared with results obtained with controls generated without reverse transcription. The number of samples that were positive for H3.X+Y and H3.X expression (+) are indicated in brackets.
Figure 2.
Subcellular localization of HA-H3.X and -H3.Y histone proteins. (A) Confocal imaging of stably transfected HeLa cells shows nuclear localization of HA-H3.1, -H3.X, and -H3.Y proteins. Cells were costained with TO-PRO3 (DNA, gray, left), α-HA (green, middle left), and α-H3S10ph (red, middle right). Overlay is shown on the right (merge). The left side shows interphase and the right side shows mitotic cells, as indicated by α-H3S10ph staining. (B) Metaphase spreads of mitotically arrested HeLa cells transfected with empty vector and HA-H3.1, -H3.X, and -H3.Y. Deconvolved wide-field images of chromosomes costained with DAPI (DNA, blue, left) and α-HA (green, middle). Sections containing one chromosome (red arrowhead) stained with α-HA are depicted on the far right. All HA-H3 variants are incorporated into chromosomes. Bars: (A) 5 µm; (B) 10 µm.
Figure 3.
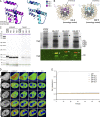
Structure and stability of H3.X- and H3.Y-containing nucleosomes. (A) In silico homology model of H3.X (purple, left) and H3.Y (light blue, right) protein structures in overlay with the crystal structure of H3.2 (dark blue). (B) Crystal structure of nucleosome with H3.2 exchanged by in silico homology models of H3.X (purple, left) and H3.Y (light blue, right), respectively. (C) IP of mononucleosomes generated from HeLa cells transfected with empty vector, HA-H3.1, -H3.X, and -H3.Y shows incorporation of novel H3 variants into nucleosomes. Bioanalyzer evaluation of purified DNA after IP of MNase-treated chromatin (unbound and bound material) shows digestion of chromatin to mononucleosomes and their successful precipitation (left; see also
Fig. S2 A
for DNA size and quality). Silver stain of 15% SDS-PAGE with α-HA IPs of mononucleosomes revealed successful binding of HA-tagged H3 variants (asterisks) and pull-down of core histones (top, right). Immunoblot of immunoprecipitates with α-HA (red) and α-H3 C-terminal (green) antibodies visualized by the Odyssey infrared imaging system (bottom, right). Notice that endogenous H3 is coimmunoprecipitated with all H3 variants analyzed. (D) FRAP experiments to evaluate nucleosomal stability of novel H3 variants using spinning disk confocal microscopy. HeLa Kyoto cells were transiently transfected with GFP, GFP-H3.1, -H3.3, -H3.X, and -H3.Y constructs. A small nuclear area was photobleached (box) and the recovery of the fluorescent signal was monitored over 1 min and up to 8 h (see Fig. S2, B–D, for long-term FRAP). Depicted is a short-term FRAP series (selected time points are shown) of GFP-tagged H3 variants compared with GFP alone. Bar, 5 µm. (E) Quantification of short-term FRAP experiment. Mean curves of 10–20 individual cells are shown. Standard deviations were very small (in the range of ± 0.02) and were omitted for clarity (for details see Fig. S2 D). All GFP-H3 variants show almost no recovery within the first 60 s after bleaching, which indicates that all expressed fusion protein was stably incorporated into nucleosomes. In contrast, GFP alone recovers to almost 100% within 5 s.
Figure 4.
Detection of endogenous H3.X and/or H3.Y proteins. (A) A monoclonal antibody against H3.X/Y (α-H3.X/Y) was generated by immunizing rats with an N-terminal peptide specific for H3.X and H3.Y (aa 9–20, see also black line in Fig. 1 A). Immunoblots of acid-extracted histones from HeLa cells stably transfected with empty vector, or vectors containing HA-H3.1, -H3.2, -H3.3, -H3.X, and -H3.Y. Histones from two independently selected HeLa cell populations expressing HA-H3.X and -H3.Y were used (#1 and #2). (A, top) Staining of the membrane with α-H3.X/Y antibody shows only signals in lanes loaded with histones from HeLa cells expressing HA-H3.X and -H3.Y, but not in lanes containing general HA-H3 variants, which demonstrates the specificity of the antibody toward the novel variants in immunoblotting. (A, bottom) Equal loading was controlled by α-HA staining. Note that all bands run slower, as expected, because of the HA tag. HA-H3.X runs even slower than all other HA-H3 variants because of its extended C-terminal tail. (B) Immunoblot analysis of acid-extracted histones from different cell lines with α-H3.X/Y antibody. (B, top) Histones from HeLa cells expressing HA-H3.X served as positive control, and histones from mouse NIH3T3 cells served as a negative control. A faint signal in the lane containing U2OS histones can be seen. (B, bottom) The identical membrane was stained with Ponceau S solution before antibody incubation to control for protein loading. Dotted lines indicate that intervening lanes have been spliced out. (C) Confocal IF analysis of U2OS cells costained with α-H3.X/Y (green), α-H3S10ph (mitosis-specific, red), and TO-PRO3 (DNA, gray). Confocal midsections are shown. (D) Confocal IF analysis of mouse (left) and rat (right) cells costained with α-H3.X/Y (green), α-H3S10ph (red), and TO-PRO3 (DNA, gray) as negative controls. (E) Confocal IF analysis of mitotic U2OS cells costained with α-H3.X/Y (green), α-H3S10ph (mitosis-specific, red), and TO-PRO3 (DNA, gray). (F) Costaining of metaphase chromosomes derived from mitotically arrested U2OS cells with α-H3.X/Y (green) and DAPI (DNA, blue). The boxed inlet shows enlargement of one chromosome. (G) Super-resolution 3D-SIM imaging of U2OS cells costained with α-H3.X/Y (green) and DAPI (DNA, blue). Depicted are cells expressing low (left) and high (right) levels of H3.X/Y. Bars: (C–F) 10 µm; (G, left) 5 µm; (G, right) 0.5 µm.
Figure 5.
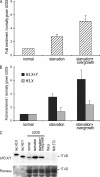
The number of cells expressing H3.X and/or H3.Y is increased by nutritional and proliferative stress. (A) Quantification of the percentage of U2OS cells positive for α-H3.X/Y nuclear staining by IF analyses under different growth conditions. U2OS cells were stained with α-H3.X/Y after 8 d of growth under different conditions: normal, starvation, or SO. The percentage of cells positive for α-H3.X/Y nuclear IF staining was determined (see Materials and methods for details) and plotted. A clear increase in the number of cells containing α-H3.X/Y–positive nuclei can be seen after growth under SO conditions. Error bars represent SEM of three independent biological experiments. (B) qPCR analysis of H3.X and H3.X+Y mRNA expression levels from U2OS cells grown under different conditions. From the same plates described in Fig. 5 A, cells were harvested, RNA was isolated, and cDNA was generated. A clear increase in H3.X+Y (dark gray) but not H3.X mRNA (light gray) under SO conditions can be detected, which is similar to the data obtained with IF analyses (Fig. 5 A). Error bars represent SEM of three independent biological experiments. (C) Immunoblot analysis of H3.X and/or H3.Y proteins isolated from U2OS cells grown under different conditions. From the same plates described in Fig. 5 A, cells were harvested, and histones were acid extracted and immunoblotted with α-H3.X/Y antibody (top). A clear increase in a 17-kD signal can be seen in U2OS cells grown under different stress conditions. Recombinant H3.X and H3.Y proteins serve as positive controls and histones from human HeLa and mouse NIH3T3 cells serve as negative controls. Staining of the same membrane with Ponceau S solution before antibody incubation was performed to ensure similar loading (bottom). One representative blot from three independent biological experiments is shown.
Figure 6.
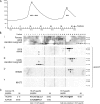
Purification and identification of endogenous H3.Y variant protein. (A) RP-HPLC section showing histone H3 peaks (see
Fig. S4 A
for complete RP-HPLC profile). Acid-extracted histones from starved and overgrown U2OS cells (Fig. 5) were separated by RP-HPLC, and histone H3 peaks (peak I, H3.2+H3.3; peak II, H3.1) spanning fractions 1–31 are shown. (B) Immunoblotting analyses of RP-HPLC fractions 1–30 spanning histone H3 peaks I to II from different cell lines under distinct growth conditions with α-H3.X/Y antibody. (i) Ponceau S staining of membrane containing histone fractions from starved and overgrown U2OS cells to detect H3.1, H3.2, and H3.3 proteins. Immunoblots incubated with α-H3.X/Y from RP-HPLC fractions from U2OS cells (ii), starved and overgrown U2OS cells (iii), HEK293 cells (iv), and mouse NIH3T3 cells (v). Dotted lines indicate that intervening lanes have been spliced out. The two anti-H3.X/Y–positive fractions are indicated with A and B. Proteins of both fractions were independently subjected to MS/MS analyses. (C) List of H3-, H3.X/Y-, and H3.Y-specific peptides identified by LC-MS/MS from combined band A–corresponding fractions from U2OS cells (normal and SO treated; see iii). Amino acids highlighted in bold are specific for H3.X and H3.Y; a bold and underlined amino acid is found only in H3.Y.
Figure 7.
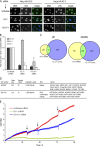
Influence of H3.Y expression on global gene regulation and cell growth. (A) Specificity determination of siRNAs against novel variants. IF microscopy using α-HA (green) and DAPI (blue) staining of HeLa cells expressing HA-H3.X and -H3.Y 4 d after RNAi treatment with indicated siRNAs. Bar, 20 µm. (B) qPCR analysis to verify efficient H3.X and H3.Y RNAi knockdown before global transcriptome analysis. Primer pair H3.X+Y (dark gray) specifically recognizes H3.X and H3.Y nucleotide sequences, whereas two other primer pairs are H3.X- (light gray) or H3.Y-specific (white). Data were normalized to HPRT1 and HMBS expression levels and depict fold enrichment of expression in comparison to luciferase control RNAi. Controls generated without reverse transcriptase were used to assess amplification threshold. Error bars represent SEM of two independent biological experiments. (C) Venn diagrams of genes deregulated after H3.X+Y (blue) and H3.Y (yellow) RNAi in SO-treated U2OS cells, as identified by microarray analyses of two independent experiments when compared with luciferase control knockdown. Digits indicate numbers of genes significantly up- (left) or down-regulated (right) in comparison to luciferase control knockdown. (D) Simplified GO analysis of overlapping genes after H3.X+Y and H3.Y knockdown. Detailed GO lists are shown in
Tables S1 and S2
. Node size = total number of genes analyzed in this node (GO term/group). (E) Growth curve of U2OS cells after RNAi (red, luciferase control siRNA; blue, H3.X+Y siRNA; green, H3.Y siRNA). Arrows mark changes of growth medium.
Figure 8.
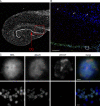
H3.X/Y protein expression in human brain. (A) Overview IF picture of commercially available human hippocampus section stained with DAPI (DNA, gray). (B) Human hippocampus sections were costained with α-H3.X/Y (red), α-NeuN (neuronal marker, green), and DAPI (DNA, blue). The boxed section from A is shown. Arrows indicate neuronal cells with positive α-H3.X/Y staining in the region above DG. One out of three representative stainings is shown. (C) The boxed section and the α-H3.X/Y–positive cell marked with an asterisk in B are shown in higher resolution. Costainings with astrocyte marker antibody (α-GFAP) are shown in
Fig. S5
. Bars: (A and B) 200 µm; (C, top) 2 µm; (C, bottom) 10 µm.
Similar articles
- H3.Y discriminates between HIRA and DAXX chaperone complexes and reveals unexpected insights into human DAXX-H3.3-H4 binding and deposition requirements.
Zink LM, Delbarre E, Eberl HC, Keilhauer EC, Bönisch C, Pünzeler S, Bartkuhn M, Collas P, Mann M, Hake SB. Zink LM, et al. Nucleic Acids Res. 2017 Jun 2;45(10):5691-5706. doi: 10.1093/nar/gkx131. Nucleic Acids Res. 2017. PMID: 28334823 Free PMC article. - Histone h3 glutathionylation in proliferating mammalian cells destabilizes nucleosomal structure.
García-Giménez JL, Òlaso G, Hake SB, Bönisch C, Wiedemann SM, Markovic J, Dasí F, Gimeno A, Pérez-Quilis C, Palacios O, Capdevila M, Viña J, Pallardó FV. García-Giménez JL, et al. Antioxid Redox Signal. 2013 Oct 20;19(12):1305-20. doi: 10.1089/ars.2012.5021. Epub 2013 May 21. Antioxid Redox Signal. 2013. PMID: 23541030 Free PMC article. - Histone H3.3 deposition at E2F-regulated genes is linked to transcription.
Daury L, Chailleux C, Bonvallet J, Trouche D. Daury L, et al. EMBO Rep. 2006 Jan;7(1):66-71. doi: 10.1038/sj.embor.7400561. EMBO Rep. 2006. PMID: 16258499 Free PMC article. - Primate-specific histone variants.
Ding D, Nguyen TT, Pang MYH, Ishibashi T. Ding D, et al. Genome. 2021 Apr;64(4):337-346. doi: 10.1139/gen-2020-0094. Epub 2020 Nov 27. Genome. 2021. PMID: 33245240 Review. - New functions for an old variant: no substitute for histone H3.3.
Elsaesser SJ, Goldberg AD, Allis CD. Elsaesser SJ, et al. Curr Opin Genet Dev. 2010 Apr;20(2):110-7. doi: 10.1016/j.gde.2010.01.003. Epub 2010 Feb 12. Curr Opin Genet Dev. 2010. PMID: 20153629 Free PMC article. Review.
Cited by
- Chromatin remodelling initiation during human spermiogenesis.
De Vries M, Ramos L, Housein Z, De Boer P. De Vries M, et al. Biol Open. 2012 May 15;1(5):446-57. doi: 10.1242/bio.2012844. Epub 2012 Mar 21. Biol Open. 2012. PMID: 23213436 Free PMC article. - Epigenetic Regulation of Myogenesis: Focus on the Histone Variants.
Esteves de Lima J, Relaix F. Esteves de Lima J, et al. Int J Mol Sci. 2021 Nov 25;22(23):12727. doi: 10.3390/ijms222312727. Int J Mol Sci. 2021. PMID: 34884532 Free PMC article. Review. - A comprehensive view of the epigenetic landscape part I: DNA methylation, passive and active DNA demethylation pathways and histone variants.
Sadakierska-Chudy A, Kostrzewa RM, Filip M. Sadakierska-Chudy A, et al. Neurotox Res. 2015 Jan;27(1):84-97. doi: 10.1007/s12640-014-9497-5. Epub 2014 Nov 2. Neurotox Res. 2015. PMID: 25362550 Free PMC article. Review. - H3.Y discriminates between HIRA and DAXX chaperone complexes and reveals unexpected insights into human DAXX-H3.3-H4 binding and deposition requirements.
Zink LM, Delbarre E, Eberl HC, Keilhauer EC, Bönisch C, Pünzeler S, Bartkuhn M, Collas P, Mann M, Hake SB. Zink LM, et al. Nucleic Acids Res. 2017 Jun 2;45(10):5691-5706. doi: 10.1093/nar/gkx131. Nucleic Acids Res. 2017. PMID: 28334823 Free PMC article. - JAZF1, A Novel p400/TIP60/NuA4 Complex Member, Regulates H2A.Z Acetylation at Regulatory Regions.
Procida T, Friedrich T, Jack APM, Peritore M, Bönisch C, Eberl HC, Daus N, Kletenkov K, Nist A, Stiewe T, Borggrefe T, Mann M, Bartkuhn M, Hake SB. Procida T, et al. Int J Mol Sci. 2021 Jan 12;22(2):678. doi: 10.3390/ijms22020678. Int J Mol Sci. 2021. PMID: 33445503 Free PMC article.
References
Publication types
MeSH terms
Substances
LinkOut - more resources
Full Text Sources
Molecular Biology Databases


