Characteristics of 454 pyrosequencing data--enabling realistic simulation with flowsim - PubMed (original) (raw)
Characteristics of 454 pyrosequencing data--enabling realistic simulation with flowsim
Susanne Balzer et al. Bioinformatics. 2010.
Erratum in
- Bioinformatics. 2011 Aug 1;27(15):2171
Abstract
Motivation: The commercial launch of 454 pyrosequencing in 2005 was a milestone in genome sequencing in terms of performance and cost. Throughout the three available releases, average read lengths have increased to approximately 500 base pairs and are thus approaching read lengths obtained from traditional Sanger sequencing. Study design of sequencing projects would benefit from being able to simulate experiments.
Results: We explore 454 raw data to investigate its characteristics and derive empirical distributions for the flow values generated by pyrosequencing. Based on our findings, we implement Flowsim, a simulator that generates realistic pyrosequencing data files of arbitrary size from a given set of input DNA sequences. We finally use our simulator to examine the impact of sequence lengths on the results of concrete whole-genome assemblies, and we suggest its use in planning of sequencing projects, benchmarking of assembly methods and other fields.
Availability: Flowsim is freely available under the General Public License from http://blog.malde.org/index.php/flowsim/.
Figures
Fig. 1.
(a) A 454 flowgram: cyclic flowing during one read. The light signal strengths (flow values) are directly translated into homopolymer runs. (b) Absolute frequencies of flow values (E.coli). Left: original data, no quality-trimming; right: quality-trimmed. The trimming algorithm enhances the separation of the homopolymer length distributions and levels out discrepancies between the nucleotides such that the curves for the four nucleotides are nearly identical.
Fig. 2.
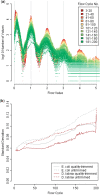
(a) Absolute frequencies of flow values by flow cycle. A total of 200 flow cycles of a Titanium run correspond to 200×4 = 800 flows. The first two flow cycles contain the TCAG tag and are omitted here. Towards the end of a run, flow values tend to lie further away from their ideal values (integers), but are obviously less in number because many values from later flow cycles have been trimmed away. (b) Standard deviation of flow values (difference in relation to their closest integer), by flow cycle. Standard deviation increases almost linearly. Only flow values <5.5 were included.
Fig. 3.
Empirical distributions (smoothed average of E.coli and D.labrax) on logarithmic scale. In gray: fitted (log-) normal distributions.
Fig. 4.
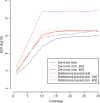
De novo and reference-based N50 for E.coli. Both real and simulated 454 data were assembled using Newbler v2.3.
Similar articles
- Systematic exploration of error sources in pyrosequencing flowgram data.
Balzer S, Malde K, Jonassen I. Balzer S, et al. Bioinformatics. 2011 Jul 1;27(13):i304-9. doi: 10.1093/bioinformatics/btr251. Bioinformatics. 2011. PMID: 21685085 Free PMC article. - Filtering duplicate reads from 454 pyrosequencing data.
Balzer S, Malde K, Grohme MA, Jonassen I. Balzer S, et al. Bioinformatics. 2013 Apr 1;29(7):830-6. doi: 10.1093/bioinformatics/btt047. Epub 2013 Feb 1. Bioinformatics. 2013. PMID: 23376350 Free PMC article. - Aggressive assembly of pyrosequencing reads with mates.
Miller JR, Delcher AL, Koren S, Venter E, Walenz BP, Brownley A, Johnson J, Li K, Mobarry C, Sutton G. Miller JR, et al. Bioinformatics. 2008 Dec 15;24(24):2818-24. doi: 10.1093/bioinformatics/btn548. Epub 2008 Oct 24. Bioinformatics. 2008. PMID: 18952627 Free PMC article. - Pyrosequencing: nucleotide sequencing technology with bacterial genotyping applications.
Clarke SC. Clarke SC. Expert Rev Mol Diagn. 2005 Nov;5(6):947-53. doi: 10.1586/14737159.5.6.947. Expert Rev Mol Diagn. 2005. PMID: 16255635 Review. - Comparative analysis of algorithms for whole-genome assembly of pyrosequencing data.
Finotello F, Lavezzo E, Fontana P, Peruzzo D, Albiero A, Barzon L, Falda M, Di Camillo B, Toppo S. Finotello F, et al. Brief Bioinform. 2012 May;13(3):269-80. doi: 10.1093/bib/bbr063. Epub 2011 Oct 21. Brief Bioinform. 2012. PMID: 22021898 Review.
Cited by
- Era of Molecular Diagnostics Techniques before and after the COVID-19 Pandemic.
Alamri AM, Alkhilaiwi FA, Ullah Khan N. Alamri AM, et al. Curr Issues Mol Biol. 2022 Oct 11;44(10):4769-4789. doi: 10.3390/cimb44100325. Curr Issues Mol Biol. 2022. PMID: 36286040 Free PMC article. Review. - Comparison of DNA extraction methods for microbial community profiling with an application to pediatric bronchoalveolar lavage samples.
Willner D, Daly J, Whiley D, Grimwood K, Wainwright CE, Hugenholtz P. Willner D, et al. PLoS One. 2012;7(4):e34605. doi: 10.1371/journal.pone.0034605. Epub 2012 Apr 13. PLoS One. 2012. PMID: 22514642 Free PMC article. - Using state machines to model the Ion Torrent sequencing process and to improve read error rates.
Golan D, Medvedev P. Golan D, et al. Bioinformatics. 2013 Jul 1;29(13):i344-51. doi: 10.1093/bioinformatics/btt212. Bioinformatics. 2013. PMID: 23813003 Free PMC article. - A broad survey of DNA sequence data simulation tools.
Alosaimi S, Bandiang A, van Biljon N, Awany D, Thami PK, Tchamga MSS, Kiran A, Messaoud O, Hassan RIM, Mugo J, Ahmed A, Bope CD, Allali I, Mazandu GK, Mulder NJ, Chimusa ER. Alosaimi S, et al. Brief Funct Genomics. 2020 Jan 22;19(1):49-59. doi: 10.1093/bfgp/elz033. Brief Funct Genomics. 2020. PMID: 31867604 Free PMC article. Review. - A multi-source domain annotation pipeline for quantitative metagenomic and metatranscriptomic functional profiling.
Ugarte A, Vicedomini R, Bernardes J, Carbone A. Ugarte A, et al. Microbiome. 2018 Aug 28;6(1):149. doi: 10.1186/s40168-018-0532-2. Microbiome. 2018. PMID: 30153857 Free PMC article.
References
- Altschul SF, et al. Basic local alignment search tool. J. Mol. Biol. 1990;215:403–410. - PubMed
- Blattner FR, et al. The complete genome sequence of Escherichia coli K-12. Science. 1997;277:1453–1462. - PubMed
- Engle ML, Burks C. GenFrag 2.1: new features for more robust fragment assembly benchmarks. Comput. Appl. Biosci. 1994;10:567–568. - PubMed
- Gomez-Alvarez V, et al. Systematic artifacts in metagenomes from complex microbial communities. ISME J. 2009;3:1314–1317. - PubMed
Publication types
MeSH terms
Substances
LinkOut - more resources
Full Text Sources
Other Literature Sources


