Medulloblastoma comprises four distinct molecular variants - PubMed (original) (raw)
. 2011 Apr 10;29(11):1408-14.
doi: 10.1200/JCO.2009.27.4324. Epub 2010 Sep 7.
Andrey Korshunov, Hendrik Witt, Thomas Hielscher, Charles G Eberhart, Stephen Mack, Eric Bouffet, Steven C Clifford, Cynthia E Hawkins, Pim French, James T Rutka, Stefan Pfister, Michael D Taylor
Affiliations
- PMID: 20823417
- PMCID: PMC4874239
- DOI: 10.1200/JCO.2009.27.4324
Medulloblastoma comprises four distinct molecular variants
Paul A Northcott et al. J Clin Oncol. 2011.
Abstract
Purpose: Recent genomic approaches have suggested the existence of multiple distinct subtypes of medulloblastoma. We studied a large cohort of medulloblastomas to determine how many subgroups of the disease exist, how they differ, and the extent of overlap between subgroups.
Methods: We determined gene expression profiles and DNA copy number aberrations for 103 primary medulloblastomas. Bioinformatic tools were used for class discovery of medulloblastoma subgroups based on the most informative genes in the data set. Immunohistochemistry for subgroup-specific signature genes was used to determine subgroup affiliation for 294 nonoverlapping medulloblastomas on two independent tissue microarrays.
Results: Multiple unsupervised analyses of transcriptional profiles identified the following four distinct, nonoverlapping molecular variants: WNT, SHH, group C, and group D. Supervised analysis of these four subgroups revealed significant subgroup-specific demographics, histology, metastatic status, and DNA copy number aberrations. Immunohistochemistry for DKK1 (WNT), SFRP1 (SHH), NPR3 (group C), and KCNA1 (group D) could reliably and uniquely classify formalin-fixed medulloblastomas in approximately 98% of patients. Group C patients (NPR3-positive tumors) exhibited a significantly diminished progression-free and overall survival irrespective of their metastatic status.
Conclusion: Our integrative genomics approach to a large cohort of medulloblastomas has identified four disparate subgroups with distinct demographics, clinical presentation, transcriptional profiles, genetic abnormalities, and clinical outcome. Medulloblastomas can be reliably assigned to subgroups through immunohistochemistry, thereby making medulloblastoma subclassification widely available. Future research on medulloblastoma and the development of clinical trials should take into consideration these four distinct types of medulloblastoma.
Conflict of interest statement
Authors' disclosures of potential conflicts of interest and author contributions are found at the end of this article.
Figures
Fig 1.
(A) Unsupervised hierarchical clustering of human 1.0 exon array expression data from 103 primary medulloblastomas using 1,450 high–standard deviation (SD) genes. Clinical features (age group, sex, and histology) for the 103 samples included in the study are shown below the dendrogram (see Data Supplement for summary of all clinical details related to the sample cohort). Age groups include infants (≤ 3 years; blue), children (4 to 15 years; green), adults (≥ 16 years; red), and unknown (black). Sex includes males (blue) and females (pink). Histology includes classic (white), desmoplastic (gray), large-cell/anaplastic (orange), medulloblastoma with extensive nodularity (brown), and unknown (black). Statistical significance for the different clinical features was determined using the χ2 test (age group) and Fisher's exact test (sex and histology). (*) P value determined by comparing sex prevalence in WNT/SHH tumors versus group C/D tumors using Fisher's exact test. (**) P value corresponds to over-representation of desmoplastic tumors in the SHH subgroup as determined using Fisher's exact test. The heatmap below the dendrogram shows the expression profile for 10 genes well characterized in medulloblastoma and demonstrates their significant pattern of differential expression among the four subgroups (see Data Supplement for summary of all differentially expressed genes identified in the four subgroups). Statistical significance of differential gene expression was determined using one-way analysis of variance. Common genomic aberrations known to occur in medulloblastoma are shown below the heatmap. Blue boxes indicate loss/deletion, red boxes indicate gain/amplification, and white boxes denote balanced copy number state for the specified genomic aberration. (B) Principal component analysis (PCA) of the primary medulloblastomas described in (A) using the same 1,450 high-SD genes used in clustering. Individual samples are represented as colored spheres (blue = WNT, red = SHH, yellow = group C, green = group D), and ellipsoids represent two SDs of the data distribution for each subgroup. (C) Age at diagnosis distribution for each of the four medulloblastoma subgroups.
Fig 2.
(A) Age at diagnosis distribution for each of the four medulloblastoma (MB) subgroups as determined by immunohistochemical staining of the MB tissue microarrays (TMAs). (B) Incidence of metastases by subgroup as determined by TMA staining. Significance was assessed by Fisher's exact test. (***) P < .001.
Fig A1.
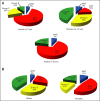
(A) Pie charts showing the frequency of the four molecular subgroups among the following three patient age categories: infants (≤ 3 years), children (4 to 15 years), and adults (≥ 16 years). (B) Pie charts showing the frequency of medulloblastoma subgroups by sex.
Fig A2.
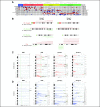
(A) Left panel: Supervised analysis of the four medulloblastoma subgroups showing the most differentially expressed signature genes that discriminate the subgroups. The top 25 signature genes for each subgroup are shown. Right panel: Prediction analysis of microarrays (PAM) was used to identify a gene signature that could robustly classify our training data set into the four molecular subgroups and predict the subgroup affiliation of samples in a test data set of 62 medulloblastomas published by Kool et al. The expression profile of signature genes identified in the test data set is shown for the predicted subgroups of the Kool data set. (B) Expression heatmap showing 40 significant genes discriminating group C and group D medulloblastomas in our cohort (left panel) and the same 40 genes described in group C and group D tumors from the Kool data set (right panel). (C) Non-negative matrix factorization (NMF) consensus analysis of our medulloblastoma cohort provides strong statistical support for the existence of four medulloblastoma subgroups. Agreement between hierarchical clustering and NMF clustering data was supported by calculation of the Rand index (Rand index, 0.931; adjusted Rand index, 0.829). (D) Subclass mapping (SubMap) analysis comparing the four medulloblastoma subgroups identified in the current study to the five subgroups previously reported by Kool et al. SubMap supports the existence of four medulloblastoma subgroups (WNT = Kool-A, SHH = Kool-B, Group C = Kool-E, Group D = Kool-C/Kool-D). (E) Incidence of metastasis in predicted medulloblastoma subgroups of the Kool data set. Subgroup affiliation was predicted for the Kool samples using PAM as described in (A), and patient metastatic status was then plotted for each of the predicted subgroups. Significance was assessed by Fisher's exact test. Coef., coefficient. *P < .01.
Fig A3.
(A) Distribution of statistically significant, subgroup-specific copy number aberrations identified by manual curation of our medulloblastoma series. Significance was determined by Fisher's exact test. Blue boxes indicate loss/deletion, red boxes indicate gain/amplification, and white boxes denote balanced copy number state for the specified genomic aberration. (B) Comparison of statistically significant copy number aberrations over-represented in group C and group D medulloblastomas. Significance was determined by Fisher's exact test. (C, D) Genomic Identification of Significant Targets in Cancer analysis of the four medulloblastoma subgroups represented in our data series. Significance plots show regions of statistically significant (C) gains/amplifications and (D) losses/deletions in the medulloblastoma subgroups. Yellow arrows indicate copy number aberrations restricted to a single subgroup, and green arrows mark regions that are significant in multiple subgroups. Loci marking select candidate genes are shown for reference.
Fig A4.
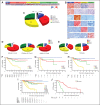
(A) Differential expression of four selected genes (DKK1, SFRP1, NPR3, and KCNA1) in the four medulloblastoma subgroups as determined by exon array expression profiling. (B) Representative immunohistochemistry for β-catenin, DKK1, SFRP1, GLI1, NPR3, and KCNA1 on a medulloblastoma tissue microarray (TMA). (C) Results obtained from immunohistochemical staining of two independent medulloblastoma TMAs (German Cancer Research Center [DKFZ] and Johns Hopkins University [JHU]) consisting of 294 nonoverlapping primary cases. Pie chart demonstrates that 288 (approximately 98%) of 294 of tumors stained positive for a single marker (DKK1, SFRP1, NPR3, or KCNA1), one (approximately 0.3%) of 294 tumors stained positive for multiple markers, and five (approximately 1.7%) of 294 tumors did not stain for any of the four markers. Significance was determined using Fisher's exact test. (D) Pie charts showing the frequency of the four molecular subgroups based on TMA staining among the following three patient age categories: infants (≤ 3 years), children (4 to 15 years), and adults (≥ 16 years). (E) Pie charts showing the frequency of medulloblastoma subgroups by sex based on TMA staining. (F) Kaplan-Meier analysis showing overall survival (OS) probability for patients on the DKFZ medulloblastoma TMA (n = 236) separated by subgroup. (G) Kaplan-Meier analysis showing OS probability for patients on the JHU TMA (n = 50) separated by subgroup. (H) Combined OS probability for both the DKFZ and JHU TMAs (n = 287) separated by subgroup. (I) Combined OS probability for both TMAs showing medulloblastoma subgroups separated by metastatic status. (J) Kaplan-Meier analysis discriminating large-cell/anaplastic (LCA; green) from non-LCA (red) histology in group C medulloblastomas present on the TMAs.
Comment in
- Molecular biology of medulloblastoma: bridging the gap between research and practice.
Gupta T, Jalali R. Gupta T, et al. Expert Rev Neurother. 2011 Apr;11(4):491-4. doi: 10.1586/ern.11.22. Expert Rev Neurother. 2011. PMID: 21469921
Similar articles
- Subgroup-specific alternative splicing in medulloblastoma.
Dubuc AM, Morrissy AS, Kloosterhof NK, Northcott PA, Yu EP, Shih D, Peacock J, Grajkowska W, van Meter T, Eberhart CG, Pfister S, Marra MA, Weiss WA, Scherer SW, Rutka JT, French PJ, Taylor MD. Dubuc AM, et al. Acta Neuropathol. 2012 Apr;123(4):485-499. doi: 10.1007/s00401-012-0959-7. Epub 2012 Feb 23. Acta Neuropathol. 2012. PMID: 22358458 Free PMC article. - Integrated genomics identifies five medulloblastoma subtypes with distinct genetic profiles, pathway signatures and clinicopathological features.
Kool M, Koster J, Bunt J, Hasselt NE, Lakeman A, van Sluis P, Troost D, Meeteren NS, Caron HN, Cloos J, Mrsić A, Ylstra B, Grajkowska W, Hartmann W, Pietsch T, Ellison D, Clifford SC, Versteeg R. Kool M, et al. PLoS One. 2008 Aug 28;3(8):e3088. doi: 10.1371/journal.pone.0003088. PLoS One. 2008. PMID: 18769486 Free PMC article. - A patient with medulloblastoma in its early developmental stage.
Shinojima N, Nakamura H, Tasaki M, Kameno K, Anai S, Iyama K, Ando Y, Seto H, Kuratsu J. Shinojima N, et al. J Neurosurg Pediatr. 2014 Dec;14(6):615-20. doi: 10.3171/2014.8.PEDS13590. Epub 2014 Oct 10. J Neurosurg Pediatr. 2014. PMID: 25303160 - Risk stratification of childhood medulloblastoma in the molecular era: the current consensus.
Ramaswamy V, Remke M, Bouffet E, Bailey S, Clifford SC, Doz F, Kool M, Dufour C, Vassal G, Milde T, Witt O, von Hoff K, Pietsch T, Northcott PA, Gajjar A, Robinson GW, Padovani L, André N, Massimino M, Pizer B, Packer R, Rutkowski S, Pfister SM, Taylor MD, Pomeroy SL. Ramaswamy V, et al. Acta Neuropathol. 2016 Jun;131(6):821-31. doi: 10.1007/s00401-016-1569-6. Epub 2016 Apr 4. Acta Neuropathol. 2016. PMID: 27040285 Free PMC article. Review. - Medulloblastoma in the age of molecular subgroups: a review.
Juraschka K, Taylor MD. Juraschka K, et al. J Neurosurg Pediatr. 2019 Oct 1;24(4):353-363. doi: 10.3171/2019.5.PEDS18381. Epub 2019 Oct 1. J Neurosurg Pediatr. 2019. PMID: 31574483 Review.
Cited by
- Application of radiomics for diagnosis, subtyping, and prognostication of medulloblastomas: a systematic review.
Fotouhi M, Shahbandi A, Mehr FSK, Shahla MM, Nouredini SM, Kankam SB, Khorasanizadeh M, Chambless LB. Fotouhi M, et al. Neurosurg Rev. 2024 Oct 29;47(1):827. doi: 10.1007/s10143-024-03060-1. Neurosurg Rev. 2024. PMID: 39467891 Review. - Comparison of DNA methylation based classification models for precision diagnostics of central nervous system tumors.
Tran QT, Breuer A, Lin T, Tatevossian R, Allen SJ, Clay M, Furtado LV, Chen M, Hedges D, Michael T, Robinson G, Northcott P, Gajjar A, Azzato E, Shurtleff S, Ellison DW, Pounds S, Orr BA. Tran QT, et al. NPJ Precis Oncol. 2024 Oct 2;8(1):218. doi: 10.1038/s41698-024-00718-3. NPJ Precis Oncol. 2024. PMID: 39358389 Free PMC article. - Cerebrospinal fluid liquid biopsy by low-pass whole genome sequencing for clinical disease monitoring in pediatric embryonal tumors.
Crotty EE, Paulson VA, Ronsley R, Vitanza NA, Lee A, Hauptman J, Goldstein HE, Lockwood CM, Leary SES, Cole BL. Crotty EE, et al. Neurooncol Adv. 2024 Jul 25;6(1):vdae126. doi: 10.1093/noajnl/vdae126. eCollection 2024 Jan-Dec. Neurooncol Adv. 2024. PMID: 39290875 Free PMC article. - Identification of tumor rejection antigens and the immunologic landscape of medulloblastoma.
Yang C, Trivedi V, Dyson K, Gu T, Candelario KM, Yegorov O, Mitchell DA. Yang C, et al. Genome Med. 2024 Aug 19;16(1):102. doi: 10.1186/s13073-024-01363-y. Genome Med. 2024. PMID: 39160595 Free PMC article. - Survival-Related Genes on Chromosomes 6 and 17 in Medulloblastoma.
Vriend J, Liu XQ. Vriend J, et al. Int J Mol Sci. 2024 Jul 9;25(14):7506. doi: 10.3390/ijms25147506. Int J Mol Sci. 2024. PMID: 39062749 Free PMC article.
References
- Ray A, Ho M, Ma J, et al. A clinicobiological model predicting survival in medulloblastoma. Clin Cancer Res. 2004;10:7613–7620. - PubMed
- Gilbertson RJ, Perry RH, Kelly PJ, et al. Prognostic significance of HER2 and HER4 coexpression in childhood medulloblastoma. Cancer Res. 1997;57:3272–3280. - PubMed
- Grotzer MA, Janss AJ, Fung K, et al. TrkC expression predicts good clinical outcome in primitive neuroectodermal brain tumors. J Clin Oncol. 2000;18:1027–1035. - PubMed
- Clifford SC, Lusher ME, Lindsey JC, et al. Wnt/Wingless pathway activation and chromosome 6 loss characterize a distinct molecular sub-group of medulloblastomas associated with a favorable prognosis. Cell Cycle. 2006;5:2666–2670. - PubMed
- Ellison DW, Onilude OE, Lindsey JC, et al. Beta-Catenin status predicts a favorable outcome in childhood medulloblastoma: The United Kingdom Children's Cancer Study Group Brain Tumour Committee. J Clin Oncol. 2005;23:7951–7957. - PubMed
Publication types
MeSH terms
Substances
LinkOut - more resources
Full Text Sources
Other Literature Sources


