The development of human functional brain networks - PubMed (original) (raw)
Review
The development of human functional brain networks
Jonathan D Power et al. Neuron. 2010.
Abstract
Recent advances in MRI technology have enabled precise measurements of correlated activity throughout the brain, leading to the first comprehensive descriptions of functional brain networks in humans. This article reviews the growing literature on the development of functional networks, from infancy through adolescence, as measured by resting-state functional connectivity MRI. We note several limitations of traditional approaches to describing brain networks and describe a powerful framework for analyzing networks, called graph theory. We argue that characterization of the development of brain systems (e.g., the default mode network) should be comprehensive, considering not only relationships within a given system, but also how these relationships are situated within wider network contexts. We note that, despite substantial reorganization of functional connectivity, several large-scale network properties appear to be preserved across development, suggesting that functional brain networks, even in children, are organized in manners similar to other complex systems.
2010 Elsevier Inc. All rights reserved.
Figures
Figure 1
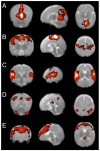
Group resting-state components in 12 sedated preterm infants. Each row shows coronal, sagittal, and axial view of components thresholded at P>0.5 (alternative-hypothesis threshold for activation vs null). (A) primary visual cortex,(B) bilateral somatosensory and motor cortex, (C) bilateral temporal/inferior parietal cortex encompassing primary auditory cortex, (D) posterior lateral and midline parts of parietal cortex and lateral cerebellum, (E) medial and lateral anterior prefrontal cortex. Figure modified from (Fransson et al., 2007).
Figure 2
Pseudo-anatomical layouts of a network of 13 DMN ROIs in (A) children 7–9 years old and (B) adults 21–31 years old. Connection widths indicate the strength of correlation between ROI timecourses, and only correlations of r > 0.15 are shown. (C) The results of a two-tailed t-test of children and adult correlations corrected for multiple comparisons at P < 0.05. Correlations that increased with age are shown in blue, and those that decreased with age are shown in red. Insets show LOWESS curves of several individual connections over development. ROIs were defined from (Fox et al., 2005). Figure modified from (Fair et al., 2008).
Figure 3
(A) The adjacency matrix of a model 22-node graph. For any two nodes, the value of the edge between them (here a 1 or 0), is found at the intersection of the respective row and column (or vice versa) of each node. For example, matrix entry (2,3) shows a value of 1, which is the edge between node 2 and node 3. (B) A spring-embedded layout of the graph, where nodes are circles, and edges are lines between the nodes. (C) A list of several node properties. We illustrate several principles with this figure: the degree of node 20 is 3, because it has 3 edges (to nodes 5, 16, and 22). These nodes are the neighbors of node 20. The clustering coefficient of this node is 0/3, since the neighbors share no edges, out of 3 possible edges. In contrast, the clustering coefficient of node 5 is 1/3. The minimum path length is the number of edges that must be crossed to travel between two nodes. In the case of nodes 2 and 18 (red arrows), the minimum path length is 4 (2-3-6-22-18). The characteristic path length and average clustering coefficient are simply the average of all minimum path lengths and clustering coefficients across the network. The values of this network, in comparison to random and regular graphs, indicate a small-world structure. The betweenness centrality of a node is (proportional to) the fraction of all shortest paths in the network that run through the node. The value for node 1 is 0, whereas the values for nodes 6 and 22 are among the highest in the network, since paths from green to blue nodes almost always use these nodes. High degree and betweenness centrality values are often used to identify hubs, but these values do not necessarily correlate with each other, and must be used with caution, as illustrated by comparing the properties of node 2 with node 18 (values circled in red). Node 2 has a relatively high betweenness centrality, despite the fact that it is evidently not playing a “central” role in the network. This “discrepancy” is because all shortest paths to node 1 must traverse node 2, inflating its betweenness centrality. Contrast the network position of node 2 with that of node 18, which has a much higher degree but only slightly higher betweenness centrality, or node 9, which has high degree but quite low betweenness centrality. Community structure is visually evident in this layout, and modularity-optimizing algorithms obtain the partition indicated by node colorings, which yields a “modularity” of 0.54. Modularity values above 0.3 are typically thought to indicate strong community structure.
Figure 4
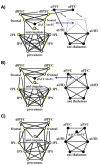
The 39-node task control graphs of Fair et al, 2007. Fronto-parietal nodes are colored in yellow, and cingulo-opercular nodes are colored in black. Graphs are portrayed in a pseudo-anatomical layout at 10% edge density. (A-C) show graph structures in children ages 7–9 years, adolescents ages 10–15 years, and adults ages 19–31 years, respectively. Note the shifting associations of aPFC and dACC/msFC nodes, and the emergence of greater frontal-parietal functional connectivity over development. ROIs and node memberships were defined in (Dosenbach et al., 2006) and (Dosenbach et al., 2007). Figure modified from (Fair et al., 2007a).
Figure 5
The 34-node graphs of task-control, default, and error-related (cerebellar) ROIs of Fair et al, 2009. Graphs are presented in spring embedded layouts at average ages 9, 13, and 25 years moving from left to right. Node centers are colored by pre-defined functional system membership (i.e. all red nodes represent published DMN coordinates), and node rims are colored by anatomical location within the brain (e.g. all blue rims indicate nodes in frontal cortex). The blue clouds (A) highlight the location of frontal nodes across development, and the red clouds (B) highlight the location of pre-defined default mode regions over development. ROIs and node memberships were defined in (Dosenbach et al., 2007; Dosenbach et al., 2006; Fair et al., 2007a; Fox et al., 2005). Figure modified from (Fair et al., 2009).
Figure 6
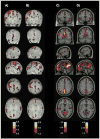
Node degree (A,C) and betweenness centrality (B,D) z-scores of voxels in voxelwise graphs in infants (A,B) and adults (C,D). Calculations were performed on adjacency matrices that were thresholded at 0.3, and then binarized. Note the congruence between the two measures within children or adults, but the evident differences between children and adult patterns. Figure adapted from (Fransson et al., 2010).
Similar articles
- Topological organization of functional brain networks in healthy children: differences in relation to age, sex, and intelligence.
Wu K, Taki Y, Sato K, Hashizume H, Sassa Y, Takeuchi H, Thyreau B, He Y, Evans AC, Li X, Kawashima R, Fukuda H. Wu K, et al. PLoS One. 2013;8(2):e55347. doi: 10.1371/journal.pone.0055347. Epub 2013 Feb 4. PLoS One. 2013. PMID: 23390528 Free PMC article. - Asymmetric development of dorsal and ventral attention networks in the human brain.
Farrant K, Uddin LQ. Farrant K, et al. Dev Cogn Neurosci. 2015 Apr;12:165-74. doi: 10.1016/j.dcn.2015.02.001. Epub 2015 Feb 12. Dev Cogn Neurosci. 2015. PMID: 25797238 Free PMC article. - Developmental pathways to functional brain networks: emerging principles.
Menon V. Menon V. Trends Cogn Sci. 2013 Dec;17(12):627-40. doi: 10.1016/j.tics.2013.09.015. Epub 2013 Nov 1. Trends Cogn Sci. 2013. PMID: 24183779 Review. - Development of the brain's functional network architecture.
Vogel AC, Power JD, Petersen SE, Schlaggar BL. Vogel AC, et al. Neuropsychol Rev. 2010 Dec;20(4):362-75. doi: 10.1007/s11065-010-9145-7. Epub 2010 Oct 27. Neuropsychol Rev. 2010. PMID: 20976563 Free PMC article. Review. - Functional brain networks develop from a "local to distributed" organization.
Fair DA, Cohen AL, Power JD, Dosenbach NU, Church JA, Miezin FM, Schlaggar BL, Petersen SE. Fair DA, et al. PLoS Comput Biol. 2009 May;5(5):e1000381. doi: 10.1371/journal.pcbi.1000381. Epub 2009 May 1. PLoS Comput Biol. 2009. PMID: 19412534 Free PMC article.
Cited by
- EEG functional connectivity is partially predicted by underlying white matter connectivity.
Chu CJ, Tanaka N, Diaz J, Edlow BL, Wu O, Hämäläinen M, Stufflebeam S, Cash SS, Kramer MA. Chu CJ, et al. Neuroimage. 2015 Mar;108:23-33. doi: 10.1016/j.neuroimage.2014.12.033. Epub 2014 Dec 19. Neuroimage. 2015. PMID: 25534110 Free PMC article. - Adolescent brain development and depression: A case for the importance of connectivity of the anterior cingulate cortex.
Lichenstein SD, Verstynen T, Forbes EE. Lichenstein SD, et al. Neurosci Biobehav Rev. 2016 Nov;70:271-287. doi: 10.1016/j.neubiorev.2016.07.024. Epub 2016 Jul 25. Neurosci Biobehav Rev. 2016. PMID: 27461914 Free PMC article. Review. - Executive functioning, ADHD symptoms and resting state functional connectivity in children with perinatal stroke.
Meghji S, Hilderley AJ, Murias K, Brooks BL, Andersen J, Fehlings D, Dlamini N, Kirton A, Carlson HL. Meghji S, et al. Brain Imaging Behav. 2024 Apr;18(2):263-278. doi: 10.1007/s11682-023-00827-w. Epub 2023 Dec 1. Brain Imaging Behav. 2024. PMID: 38038867 Free PMC article. - Resting-state functional connectivity of the amygdala and longitudinal changes in depression severity in adolescent depression.
Connolly CG, Ho TC, Blom EH, LeWinn KZ, Sacchet MD, Tymofiyeva O, Simmons AN, Yang TT. Connolly CG, et al. J Affect Disord. 2017 Jan 1;207:86-94. doi: 10.1016/j.jad.2016.09.026. Epub 2016 Sep 23. J Affect Disord. 2017. PMID: 27716542 Free PMC article. - The organization of the human striatum estimated by intrinsic functional connectivity.
Choi EY, Yeo BT, Buckner RL. Choi EY, et al. J Neurophysiol. 2012 Oct;108(8):2242-63. doi: 10.1152/jn.00270.2012. Epub 2012 Jul 25. J Neurophysiol. 2012. PMID: 22832566 Free PMC article.
References
- Albert Jeong, Barabasi Error and attack tolerance of complex networks. Nature. 2000;406:378–382. - PubMed
- Albert R, Jeong H, Barabasi AL. Internet: Diameter of the World-Wide Web. Nature. 1999;401:130–131.
- Barabasi AL, Albert R. Emergence of scaling in random networks. Science. 1999;286:509–512. - PubMed
- Bi G, Poo M. Distributed synaptic modification in neural networks induced by patterned stimulation. Nature. 1999;401:792–796. - PubMed
Publication types
MeSH terms
Grants and funding
- R01 NS032979/NS/NINDS NIH HHS/United States
- R01 NS046424/NS/NINDS NIH HHS/United States
- K02 NS053425/NS/NINDS NIH HHS/United States
- R01 HD057076/HD/NICHD NIH HHS/United States
- R21 NS041255/NS/NINDS NIH HHS/United States
LinkOut - more resources
Full Text Sources


