Global gene expression profiling of somatic motor neuron populations with different vulnerability identify molecules and pathways of degeneration and protection - PubMed (original) (raw)
Global gene expression profiling of somatic motor neuron populations with different vulnerability identify molecules and pathways of degeneration and protection
Eva Hedlund et al. Brain. 2010 Aug.
Abstract
Different somatic motor neuron subpopulations show a differential vulnerability to degeneration in diseases such as amyotrophic lateral sclerosis, spinal muscular atrophy and spinobulbar muscular atrophy. Studies in mutant superoxide dismutase 1 over-expressing amyotrophic lateral sclerosis model mice indicate that initiation of disease is intrinsic to motor neurons, while progression is promoted by astrocytes and microglia. Therefore, analysis of the normal transcriptional profile of motor neurons displaying differential vulnerability to degeneration in motor neuron disease could give important clues to the mechanisms of relative vulnerability. Global gene expression profiling of motor neurons isolated by laser capture microdissection from three anatomical nuclei of the normal rat, oculomotor/trochlear (cranial nerve 3/4), hypoglossal (cranial nerve 12) and lateral motor column of the cervical spinal cord, displaying differential vulnerability to degeneration in motor neuron disorders, identified enriched transcripts for each neuronal subpopulation. There were striking differences in the regulation of genes involved in endoplasmatic reticulum and mitochondrial function, ubiquitination, apoptosis regulation, nitrogen metabolism, calcium regulation, transport, growth and RNA processing; cellular pathways that have been implicated in motor neuron diseases. Confirmation of genes of immediate biological interest identified differential localization of insulin-like growth factor II, guanine deaminase, peripherin, early growth response 1, soluble guanylate cyclase 1A3 and placental growth factor protein. Furthermore, the cranial nerve 3/4-restricted genes insulin-like growth factor II and guanine deaminase protected spinal motor neurons from glutamate-induced toxicity (P < 0.001, ANOVA), indicating that our approach can identify factors that protect or make neurons more susceptible to degeneration.
Figures
Figure 1
LCM of motor neurons from subpopulations showing differential vulnerability to degeneration in amyotrophic lateral sclerosis. (A) Approximately 40% of cervical spinal motor neurons had degenerated in the SOD1G93A rats at the time of disease onset, as defined by grip strength analysis, while the number of motor neurons in the different brain stem nuclei remained unchanged. (B) Schematic figure depicting the rat brain, brainstem and spinal cord, displaying three nuclei of motor neurons along the rostrocaudal axis of the CNS which show differential vulnerability to degeneration in amyotrophic lateral sclerosis: CN3/4, CN12 and the lateral motor column of the cervical spinal cord. Motor neurons in the (C–F) CN3/4, (G–J) CN12 and (K–N) the cervical spinal cord, visualized by (C, G and K) choline acetyltransferase (ChAT) staining or (D, H and L) HistoGene staining were isolated by LCM (E, F, I, J, M and N).
Figure 2
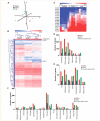
Global gene expression analysis of motor neurons isolated from CN3/4, CN12 and the cervical spinal cord of normal rats. (A) Correspondence analysis of the gene expression data (22 911 genes) showed that individual samples within each nucleus clustered together and that motor neurons of the CN12 and the cervical spinal cord were closely associated, whereas motor neurons of CN3/4 were less associated with the other motor neuron nuclei. (B) Hierarchial clustering, using Euclidean distance, of the 1968 genes (extracted by ANOVA using a _P_-value set to 0.01) that were differentially expressed between the three nuclei, showed that individual samples within each somatic motor neuron nucleus clustered closely together, and that motor neurons of CN12 shared more genes with those of the cervical spinal cord compared to CN3/4. Within the heat map, the location of peripherin, which was predominantly expressed in spinal motor neurons, and the CN3/4-restricted genes IGF-II and guanine deaminase (GDA) have been indicated. (C) Heat map displaying the differential expression pattern of Hox genes in motor neuron subpopulations (CN3/4, CN12 and cervical spinal cord) according to their anterior–posterior position within the brain and spinal cord (extracted using two-sided _t-_test with 1000 permutations, and a _P_-value set to ≤ 0.05). (D–F) Examples of gene groups that showed a high differential expression level between the three different motor neuron subpopulations. ALS = amyotrophic lateral sclerosis.
Figure 3
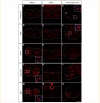
Confirmation of protein expression of genes differentially expressed in motor neurons of the cervical spinal cord, CN12 and the CN3/4. Immunofluorescent analysis using confocal microscopy was used to analyse the protein expression of genes found to be differentially expressed between different groups of motor neurons using microarray. Consistent with the microarray RNA data, the protein expression of peripherin in motor neurons of CN3/4 (A) and CN12 appeared low (B), whereas in cervical spinal cord it was high (C and inset). Placental growth factor (PGF) was localized to motor neurons of the spinal cord (F and inset) and to a lesser extent to motor neuron of CN3/4 (D) and CN12 (E). IGF-II protein was expressed in motor neurons of CN3/4 (G and inset), but was below the detection level in motor neurons of CN12 (H) and the cervical spinal cord (I). Gucy1a3 protein was present in motor neurons of the CN3/4. Gucy1a3 was also localized to additional cell types within and surrounding the CN3/4 (J and inset). The level of Gucy1a3 in CN12 was very low (K) whereas it was more easily detected in motor neurons of the cervical spinal cord (L). Early growth response 1 (Egr-1) protein was highly expressed in motor neurons of CN3/4 (M), while the expression level in motor neurons of CN12 and the cervical spinal cord was much lower (N and O). Scale bar: 100 µm (O, applies to A–N).
Figure 4
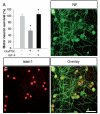
IGF-II protected spinal motor neurons in primary culture from glutamate-induced toxicity. (A) The number of spinal motor neurons in primary culture was significantly decreased after the addition of 20 µM glutamate (Glu) and 100 µM of the glutamate uptake blocker PDC (P < 0.001, ANOVA). Pretreatment of the cultures with IGF-II (10–100 ng/ml) for 2–4 h prior to glutamate insult protected motor neurons against the toxicity (P < 0.001, ANOVA). Confocal analysis of (B and D) 150 kD neurofilament (NF) and (C and D) islet-1 expression in primary spinal cord cultures pretreated with IGF-II show the presence of large numbers of motor neurons in the cultures after 7 days of combined IGF-II and glutamate treatment. Scale bar: 50 µm (D, applies to B and C). Asterisk signifies a statistically significant difference with a P < 0.01, by ANOVA.
Figure 5
Guanine deaminase was expressed within CN3/4 motor neurons and exogenous delivery protected primary spinal motor neurons from glutamate toxicity. Immunofluorescent analysis using confocal microscopy was used to analyse the protein expression of guanine deaminase (GDA). (A) Striatal tissue was used as a positive control for the antibody staining. (B and E) Consistent with the microarray RNA data, guanine deaminase protein was present in motor neurons of the CN3/4 as well as within other surrounding cell types within this nucleus. The level of guanine deaminase in CN12 and cervical spinal cord was very low (C and D). (F–I) The addition of glutamate (Glu, 20 µM) and the glutamate uptake blocker PDC (100 µM) to primary spinal cord culture decreased the number of motor neurons (P < 0.001, ANOVA). Pretreatment of the cultures with guanine deaminase (100 ng/ml) for 3–4 h prior to glutamate insult protected motor neurons against the toxicity (P < 0.001, ANOVA). Scale bars: 100 µm (D, applies to A–C), 50 µm (E) and 50 µm (I, applies to G and H). ChAT = choline acetyltransferase. Asterisk signifies a statistically significant difference with a P < 0.01, by ANOVA.
Similar articles
- Phosphatase and tensin homologue/protein kinase B pathway linked to motor neuron survival in human superoxide dismutase 1-related amyotrophic lateral sclerosis.
Kirby J, Ning K, Ferraiuolo L, Heath PR, Ismail A, Kuo SW, Valori CF, Cox L, Sharrack B, Wharton SB, Ince PG, Shaw PJ, Azzouz M. Kirby J, et al. Brain. 2011 Feb;134(Pt 2):506-17. doi: 10.1093/brain/awq345. Epub 2011 Jan 12. Brain. 2011. PMID: 21228060 Free PMC article. - Calcitonin gene-related peptide expression levels predict motor neuron vulnerability in the superoxide dismutase 1-G93A mouse model of amyotrophic lateral sclerosis.
Ringer C, Weihe E, Schütz B. Ringer C, et al. Neurobiol Dis. 2012 Jan;45(1):547-54. doi: 10.1016/j.nbd.2011.09.011. Epub 2011 Sep 21. Neurobiol Dis. 2012. PMID: 21964254 - A potential role for the p75 low-affinity neurotrophin receptor in spinal motor neuron degeneration in murine and human amyotrophic lateral sclerosis.
Lowry KS, Murray SS, McLean CA, Talman P, Mathers S, Lopes EC, Cheema SS. Lowry KS, et al. Amyotroph Lateral Scler Other Motor Neuron Disord. 2001 Sep;2(3):127-34. doi: 10.1080/146608201753275463. Amyotroph Lateral Scler Other Motor Neuron Disord. 2001. PMID: 11771768 - RNA dysregulation in diseases of motor neurons.
Ibrahim F, Nakaya T, Mourelatos Z. Ibrahim F, et al. Annu Rev Pathol. 2012;7:323-52. doi: 10.1146/annurev-pathol-011110-130307. Epub 2011 Oct 24. Annu Rev Pathol. 2012. PMID: 22035195 Review. - Role of complement in motor neuron disease: animal models and therapeutic potential of complement inhibitors.
Woodruff TM, Costantini KJ, Taylor SM, Noakes PG. Woodruff TM, et al. Adv Exp Med Biol. 2008;632:143-58. Adv Exp Med Biol. 2008. PMID: 19025120 Review.
Cited by
- Downstream Effects of Mutations in SOD1 and TARDBP Converge on Gene Expression Impairment in Patient-Derived Motor Neurons.
Dash BP, Freischmidt A, Weishaupt JH, Hermann A. Dash BP, et al. Int J Mol Sci. 2022 Aug 25;23(17):9652. doi: 10.3390/ijms23179652. Int J Mol Sci. 2022. PMID: 36077049 Free PMC article. - AAV9-Stathmin1 gene delivery improves disease phenotype in an intermediate mouse model of spinal muscular atrophy.
Villalón E, Kline RA, Smith CE, Lorson ZC, Osman EY, O'Day S, Murray LM, Lorson CL. Villalón E, et al. Hum Mol Genet. 2019 Nov 15;28(22):3742-3754. doi: 10.1093/hmg/ddz188. Hum Mol Genet. 2019. PMID: 31363739 Free PMC article. - Single-cell transcriptomics identifies master regulators of neurodegeneration in SOD1 ALS iPSC-derived motor neurons.
Namboori SC, Thomas P, Ames R, Hawkins S, Garrett LO, Willis CRG, Rosa A, Stanton LW, Bhinge A. Namboori SC, et al. Stem Cell Reports. 2021 Dec 14;16(12):3020-3035. doi: 10.1016/j.stemcr.2021.10.010. Epub 2021 Nov 11. Stem Cell Reports. 2021. PMID: 34767750 Free PMC article. - Multi-omic analysis of selectively vulnerable motor neuron subtypes implicates altered lipid metabolism in ALS.
Lee H, Lee JJ, Park NY, Dubey SK, Kim T, Ruan K, Lim SB, Park SH, Ha S, Kovlyagina I, Kim KT, Kim S, Oh Y, Kim H, Kang SU, Song MR, Lloyd TE, Maragakis NJ, Hong YB, Eoh H, Lee G. Lee H, et al. Nat Neurosci. 2021 Dec;24(12):1673-1685. doi: 10.1038/s41593-021-00944-z. Epub 2021 Nov 15. Nat Neurosci. 2021. PMID: 34782793 Free PMC article. - The role of PSD-95 and cypin in morphological changes in dendrites following sublethal NMDA exposure.
Tseng CY, Firestein BL. Tseng CY, et al. J Neurosci. 2011 Oct 26;31(43):15468-80. doi: 10.1523/JNEUROSCI.2442-11.2011. J Neurosci. 2011. PMID: 22031893 Free PMC article.
References
- Abrams CS, Wu H, Zhao W, Belmonte E, White D, Brass LF. Pleckstrin inhibits phosphoinositide hydrolysis initiated by G-protein-coupled and growth factor receptors. A role for pleckstrin's PH domains. J Biol Chem. 1995;270:14485–92. - PubMed
- Adelman JP, Bond CT, Pessia M, Maylie J. Episodic ataxia results from voltage-dependent potassium channels with altered functions. Neuron. 1995;15:1449–54. - PubMed
- Akum BF, Chen M, Gunderson SI, Riefler GM, Scerri-Hansen MM, Firestein BL. Cypin regulates dendrite patterning in hippocampal neurons by promoting microtubule assembly. Nat Neurosci. 2004;7:145–52. - PubMed
- Arber S, Ladle DR, Lin JH, Frank E, Jessell TM. ETS gene Er81 controls the formation of functional connections between group Ia sensory afferents and motor neurons. Cell. 2000;101:485–98. - PubMed
Publication types
MeSH terms
Substances
LinkOut - more resources
Full Text Sources
Other Literature Sources
Miscellaneous


