Pyramidal neurons are generated from oligodendroglial progenitor cells in adult piriform cortex - PubMed (original) (raw)
Pyramidal neurons are generated from oligodendroglial progenitor cells in adult piriform cortex
Fuzheng Guo et al. J Neurosci. 2010.
Abstract
Previous studies have shown that oligodendroglial progenitor cells (OPCs) can give rise to neurons in vitro and in perinatal cerebral cortex in vivo. We now report that OPCs in adult murine piriform cortex express low levels of doublecortin, a marker for migratory and immature neurons. Additionally, these OPCs express Sox2, a neural stem cell marker, and Pax6, a transcription factor characteristic of progenitors for cortical glutamatergic neurons. Genetic fate-mapping by means of an inducible Cre-LoxP recombination system proved that these OPCs differentiate into pyramidal glutamatergic neurons in piriform cortex. Several lines of evidence indicated that these newly formed neurons became functionally integrated into the cortical neuronal network. Our data suggest that NG2(+)/PDGFRα(+) proteolipid protein promoter-expressing progenitors generate pyramidal glutamatergic neurons within normal adult piriform cortex.
Figures
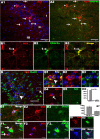
Figure 1.
OPCs in the cortex express low-level doublecortin. Double immunohistochemistry depicting high-level DCX (red)-expressing (A1, A2, arrowheads) and low-level DCX (red)-expressing (A1, A2, arrows) cells in the piriform cortex. Low-level DCX-expressing cells were colabeled with PDGFRα (green) (arrows in A2, B1–B3) and were negative for HuCD (green) (D4, D5), and high-level DCX-expressing cells colocalized with HuCD (green) (D1–D3). B1–B3, Orthogonal views of the cell pointed by arrow 1 in A2. D1–D3 and D4,D5 showed orthogonal views of boxed areas pointed by arrowhead an arrow in D, respectively. D6, Percentage of high-level (DCX++) and low-level (DCX+) DCX-expressing cells that were positive for HuCD. D7, Data showing DCX protein expression levels by DCX++ and DCX+ cells. E1–E3, DCX (red)/HuCD (green) double-positive cells with morphology like that of OPCs. F1–F3, Low-level DCX (red)-expressing cells (arrows) located close to HuCD+ (green) neurons. G1–G4, DCX+ (red)/PDGFRα+ (blue) cells were colabeled with Sox10 (green). I, II, and III in A1 stand for layer I, II, and III of piriform cortex, respectively, in this and subsequent figures. All the pictures were taken from P45–P60 mice. Scale bars: A1, A2, D, 50 μm; E1, F1, G4, 10 μm.
Figure 2.
Genetic labeling of adult OPCs in the piriform cortex. A, Almost all EYFP+ cells expressed Sox10 (red). B, C, A subpopulation of EYFP+ cells were NG2+ (red) or PDGFRα+ (red) putative OPCs, respectively. D, Recombination rate in NG2+/PDGFRα+ OPCs on different days after last tamoxifen injection. Note that recombination reached a plateau after 5 d after TM. E, Recombination rates in NG2+/PDGFRα+ OPCs at different ages. Virtually no NeuN+ (red) (F) or HuCD+ (red) (G) cells were labeled before 17 d after TM. H, No Iba-1+ (red) microglia were labeled with EYFP. Arrows in A–C point to examples of double-labeled cells. Arrowhead in A, single-labeled cell. Scale bars, 50 μm.
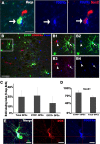
Figure 3.
Phenotypic features of EYFP+ OPCs. A, Fluorescent micrographs depicting EYFP+ (green)/PDGFRα+ (blue) putative OPCs expressing the neural stem cell marker Sox2 (red). B, Triple staining for EYFP, PDGFRα (red), and Pax6 (blue) showing Pax6 expression in OPCs. The boxed area in B is shown at higher magnification in B1–B4. Both PDGFRα+ (arrowheads in B1–B4) and PDGFRα+/EYFP+ (arrows in B1–B4) displayed nuclear Pax6 immunoreactivity. C, BrdU labeling index in total OPCs, EYFP− OPCs, and EYFP+ OPCs, respectively, after 9 d BrdU administration in drinking water starting on P45. Note that the labeling index of EYFP+ OPCs was ∼10% lower than that of EYFP− OPCs. D, Percentages of EYFP+ OPCs and total OPCs that were Sox2+, respectively. E, EYFP+/ PDGFRα+ (blue) putative OPCs expressed DCX (red). Scale bars, 10 μm.
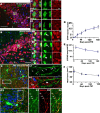
Figure 4.
Generation of EYFP+ neurons from EYFP+ OPCs. A, EYFP+ and HuCD+ (red) double-positive neurons at 90 d after TM. A1–A3, Orthogonal images from confocal _z_-section levels of boxed cell in A showing definitive colocalization of EYFP and HuCD. B, Consistently, some EYFP+ cells were colabeled with NeuN (red) on 180 d after TM. Boxed area is shown in higher magnifications in orthogonal images of B1–B3. Wavy arrow in B points to a layer III EYFP+/NeuN+ neuron. Arrows in B1 and B2 show EYFP+/NeuN+ cells, whereas arrowheads in B3 depict EYFP+ cells that were NeuN negative. C, Double immunostaining for EYFP and SMI312 (red). White box is shown at higher magnification in C1 and C2. Arrows in C1 pointed to EYFP+ dendritic spines. C2, EYFP+/SMI312− dendrites with tiny spines extended through layer Ib into superficial layer Ia. C3–C6 showing EYFP+ neurites colocalized with SMI312 (arrows in C4–C6). D, Number of EYFP+/NeuN+ neuron neurons per 14-μm-thick section at different time points after TM. Note that there was an accumulation of EYFP+ neurons. E, At the same time, the percentage of EYFP+ OPCs among total OPCs decreased over time after TM. F, Quantification of NG2+ OPCs (cells/mm2) in 14 μm sections of piriform cortex during the ensuing days after TM. y-z and x-z in A1 and B1 means y–z and x–z two dimension, respectively. Scale bars, 50 μm.
Figure 5.
GFAP+ NSCs and DCX+ neuroblasts in SVZ are not labeled with EYFP. A, Fluorescent micrographs depicting the absence of EYFP expression in GFAP+ (red) neural stem cells of both dorsolateral and ventral tip of SVZ on day 10 after TM. Boxed area is shown at higher magnification in A1–A3. B, Consistently, no DCX++ (red) neuroblasts in SVZ expressed EYFP. B1–B3, Higher-magnification images of boxed area in B. CC, Corpus callosum; LV, lateral ventricle. Scale bars: A, B, 50 μm; B3, 30 μm.
Figure 6.
OPCs generate immature neurons. A–A3, Triple-fluorescent confocal _z_-sections show an EYFP and low-level DCX (red) double-positive perineuronal progenitor that is adjacent to an HuCD+ (blue) neuron. B–B3, Arrows designating an immature neuron that expresses EYFP, HuCD (blue), and high-level DCX (red), with arrowheads and insets showing an example of mature neurons that display EYFP and HuCD (blue) expression and undetectable DCX (red). Cells pointed by arrowheads in B–B3 are shown as orthogonal views in corresponding insets. C–C3, Immature EYFP+ neurons are colabeled with Tuj1 (red) in both cell bodies (arrowheads) and neurites (arrows) in this single confocal slice. D–D3, EYFP+/HuCD+ (blue) neurons (arrows) show nuclear Tbr1 immunoreactivity (red). D1–D3, Single-channel view of image D. All pictures are taken from piriform cortex. Scale bars, 10 μm.
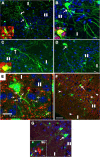
Figure 7.
Morphology and phenotype of OPC-derived neurons. A, An EYFP+ neuron in layer II of piriform cortex displays typical morphology of pyramidal neurons. A single thick apical dendritic trunk (arrow) extending toward pial surface (top left) and branching at layer I (wavy arrow). Multiple basal dendrites (arrowheads) extending toward layers II and III. Inset in A shows EYFP and NeuN double immunostaining. B, C, EYFP fluorescence micrographs showing layer II pyramidal neurons with varied morphologies, including different lengths of apical dendritic trunks (arrows in B, C). Insets in B and C shows EYFP+/NeuN+ (red) cell bodies. D, An example of layer III EYFP+ large pyramidal neurons. E, Orthogonal view of EYFP and vGLUT1 (red) double-immunostaining micrograph. Note punctate vGLUT1 immunoreactivity in EYFP+ neuron (arrows). F, G, Large-sized EYFP+ neurons (arrows) were negative for GAD67 (red) and ChAT (red), respectively. Arrowheads in F point to GAD67+ cells. Inset in G shows a positive control of ChAT immunostaining from striatum area (Str). Scale bars: A–D, E, G, 10 μm; F, 50 μm.
Figure 8.
Evidences that OPC-derived piriform cortical neurons are functional. A1, EYFP and synapsin (Syn; red) double-fluorescent image shows many synapsin+ punctae (arrows) that were in close proximity to EYFP+ spines. A2, Gray image from A1 depicting the existence of many EYFP+ spines (arrows) along an EYFP+ dendrite. B1–B4, A preexisting NeuN+ (blue) neuron (arrows) expresses NR1 (red). Similarly, a newly generated EYFP+/NeuN+ neuron (arrowheads) displays NR1 immunoreactivity. C1, Triple-fluorescent image of EYFP, c-Fos (red), and NeuN (blue) depicting EYFP+/NeuN+ neuron that has nuclear c-Fos expression (arrow). C2, C3, Images of individual channels of cell indicated by arrow in C1. Ia, Layer Ia of piriform cortex; Ib, layer Ib. Scale bars, 10 μm.
Similar articles
- PDGFRA/NG2 glia generate myelinating oligodendrocytes and piriform projection neurons in adult mice.
Rivers LE, Young KM, Rizzi M, Jamen F, Psachoulia K, Wade A, Kessaris N, Richardson WD. Rivers LE, et al. Nat Neurosci. 2008 Dec;11(12):1392-401. doi: 10.1038/nn.2220. Epub 2008 Oct 8. Nat Neurosci. 2008. PMID: 18849983 Free PMC article. - Early postnatal proteolipid promoter-expressing progenitors produce multilineage cells in vivo.
Guo F, Ma J, McCauley E, Bannerman P, Pleasure D. Guo F, et al. J Neurosci. 2009 Jun 3;29(22):7256-70. doi: 10.1523/JNEUROSCI.5653-08.2009. J Neurosci. 2009. PMID: 19494148 Free PMC article. - Transient Cnp expression by early progenitors causes Cre-Lox-based reporter lines to map profoundly different fates.
Tognatta R, Sun W, Goebbels S, Nave KA, Nishiyama A, Schoch S, Dimou L, Dietrich D. Tognatta R, et al. Glia. 2017 Feb;65(2):342-359. doi: 10.1002/glia.23095. Epub 2016 Nov 3. Glia. 2017. PMID: 27807896 Free PMC article. - BM88 is an early marker of proliferating precursor cells that will differentiate into the neuronal lineage.
Koutmani Y, Hurel C, Patsavoudi E, Hack M, Gotz M, Thomaidou D, Matsas R. Koutmani Y, et al. Eur J Neurosci. 2004 Nov;20(10):2509-23. doi: 10.1111/j.1460-9568.2004.03724.x. Eur J Neurosci. 2004. PMID: 15548196 - AP2gamma regulates basal progenitor fate in a region- and layer-specific manner in the developing cortex.
Pinto L, Drechsel D, Schmid MT, Ninkovic J, Irmler M, Brill MS, Restani L, Gianfranceschi L, Cerri C, Weber SN, Tarabykin V, Baer K, Guillemot F, Beckers J, Zecevic N, Dehay C, Caleo M, Schorle H, Götz M. Pinto L, et al. Nat Neurosci. 2009 Oct;12(10):1229-37. doi: 10.1038/nn.2399. Epub 2009 Sep 13. Nat Neurosci. 2009. PMID: 19749747
Cited by
- NG2-glia and their functions in the central nervous system.
Dimou L, Gallo V. Dimou L, et al. Glia. 2015 Aug;63(8):1429-51. doi: 10.1002/glia.22859. Epub 2015 May 24. Glia. 2015. PMID: 26010717 Free PMC article. Review. - Degeneration and impaired regeneration of gray matter oligodendrocytes in amyotrophic lateral sclerosis.
Kang SH, Li Y, Fukaya M, Lorenzini I, Cleveland DW, Ostrow LW, Rothstein JD, Bergles DE. Kang SH, et al. Nat Neurosci. 2013 May;16(5):571-9. doi: 10.1038/nn.3357. Epub 2013 Mar 31. Nat Neurosci. 2013. PMID: 23542689 Free PMC article. - Chromatin landscape defined by repressive histone methylation during oligodendrocyte differentiation.
Liu J, Magri L, Zhang F, Marsh NO, Albrecht S, Huynh JL, Kaur J, Kuhlmann T, Zhang W, Slesinger PA, Casaccia P. Liu J, et al. J Neurosci. 2015 Jan 7;35(1):352-65. doi: 10.1523/JNEUROSCI.2606-14.2015. J Neurosci. 2015. PMID: 25568127 Free PMC article. - Oligodendrocytes in a Nutshell.
Michalski JP, Kothary R. Michalski JP, et al. Front Cell Neurosci. 2015 Sep 1;9:340. doi: 10.3389/fncel.2015.00340. eCollection 2015. Front Cell Neurosci. 2015. PMID: 26388730 Free PMC article. Review. - Prenatal genesis of layer II doublecortin expressing neurons in neonatal and young adult guinea pig cerebral cortex.
Yang Y, Xie MX, Li JM, Hu X, Patrylo PR, Luo XG, Cai Y, Li Z, Yan XX. Yang Y, et al. Front Neuroanat. 2015 Aug 10;9:109. doi: 10.3389/fnana.2015.00109. eCollection 2015. Front Neuroanat. 2015. PMID: 26321922 Free PMC article.
References
- Arvidsson A, Collin T, Kirik D, Kokaia Z, Lindvall O. Neuronal replacement from endogenous precursors in the adult brain after stroke. Nat Med. 2002;8:963–970. - PubMed
Publication types
MeSH terms
Substances
LinkOut - more resources
Full Text Sources


